EducationSoftwareStrategy.com
StrategyCommunity

Knowledge Base

Product

Community

Knowledge Base

TopicsBrowse ArticlesDeveloper Zone

Product

Download SoftwareProduct DocumentationSecurity Hub

Education

Tutorial VideosSolution GalleryEducation courses

Community

GuidelinesGrandmastersEvents
x_social-icon_white.svglinkedin_social-icon_white.svg
Strategy logoCommunity

© Strategy Inc. All Rights Reserved.

LegalTerms of UsePrivacy Policy
  1. Home
  2. Topics

KB220133: Non aggregating metrics show incorrect values in subtotals at different levels of dimensionality in MicroStrategy Developer


Stefan Zepeda

Salesforce Solutions Architect • Strategy


Non aggregating metrics are typically used for values that do not derive their values from typical arithmetic functions like sum, difference, product, etc.  A scenario may exist where the values of non aggregating metrics are desired to be seen at multiple levels within a hierarchy, but the subtotal values may differ at a lower level of granularity versus a higher level of granularity if nulls are present in the data.  This article aims to explain this behavior.

SUMMARY
Non aggregating metrics are typically used for values that do not derive their values from typical arithmetic functions like sum, difference, product, etc.  A scenario may exist where the values of non aggregating metrics are desired to be seen at multiple levels within a hierarchy, but the subtotal values may differ at a lower level of granularity versus a higher level of granularity if nulls are present in the data.  This article aims to explain this behavior.
 
DESCRIPTION
When warehouse nulls are present or simulated in data with non aggregating metrics, and the metrics are desired to display values at various levels of dimensionality in a hierarchy, then an issue may exist where subtotals display different values at different levels.  This can be reproduced in Strategy Tutorial with a simple report design.
 
STEPS TO REPRODUCE
  1. Create a copy of the End on Hand metric
    • In this example, it is named as ZTN EOH (stands for ZeroToNull End on Hand)
  2. Within the End on Hand metric, add the level of Month with Standard filtering and Ending (Fact) grouping
  3. Do the same within the copy of the End on Hand metric
  4. In the copy of the End on Hand metric, add the function ZeroToNull() around the existing definition – this is meant to simulate warehouse nulls for any value of zero
  5. Lastly, in the copy of the End on Hand metric, set the Subtotaling function from Sum to Default
    • This is to prevent the subtotal from summing values of multiple elements of Time, which should not be done in a non aggregating metric
  6. Create a new report in Strategy Tutorial
  7. Add the Item attribute to the rows, the Month attribute to the columns, and the End on Hand and ZTN EOH metric to the columns
  8. Create a report filter for Month In List Nov2011 and Dec2011
  9. Execute the report
  10. Enable Grand Totals, and set the subtotals to display at the top of the grid (for ease of viewing)
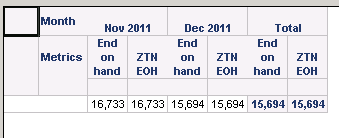
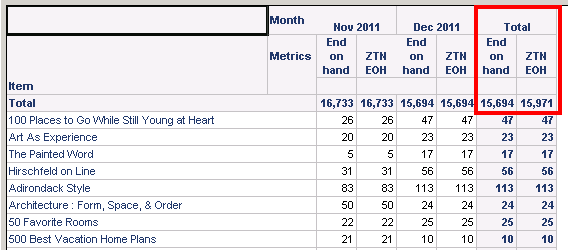
  11. Notice that the subtotal values match for End on Hand and ZTN EOH for the elements of Month, but differ for the Grand Total column
  12. Scroll down through the data and find an instance of where a 0 appears in Dec2011, and notice the behavior in the subtotals
    • When a 0 appears in Dec2011 for ZTN EOH, it shows as a null, and the subtotal uses the last value shown in the report – which was 73. This will change the grand total subtotal.
    • When a 0 appears in Nov2011 for ZTN EOH, but a value shows in Dec2011, then the subtotal correctly uses the Dec2011 value.
  13. Lastly, observe that when Item is dragged off of the grid and into the report objects window, all the subtotal values match.
  14. Placing Item back on the grid shows the discrepancy in grand total values again, so this appears to happen at lower levels of dimensionality.


ka02R000000kX3rQAE_0EM440000002CBH.jpeg


ka02R000000kX3rQAE_0EM440000002CBP.jpeg


ka02R000000kX3rQAE_0EM440000002CBL.jpeg

 
VIDEO
 
 
CAUSE
The cause for the behavior is due to warehouse nulls showing up in the data, but other values show up as well in earlier periods of time.  End on hand will take the last value, and in this case the Analytical Engine appears to pass the last displayed value – excluding the null when an actual value is present in the grid – to the subtotal for grand totaling.  When the value is not a null and is a zero, then the zero is appropriately passed and used in the subtotal.
 
ACTION
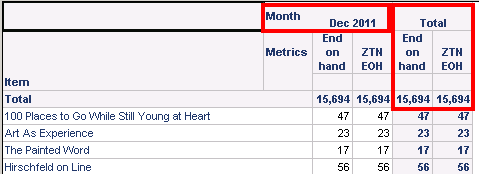
One method that was found to force the subtotal to use the warehouse null was to only display a single moment in time that had the null, and no other data.  In the example used here, this would mean that only Dec2011 is shown on the grid, and the Analytical Engine will use the null value in the subtotal and pass it as a 0.
 

ka02R000000kX3rQAE_0EM440000002CBN.jpeg


ka02R000000kX3rQAE_0EM440000002CBR.jpeg

 
Null handling for this particular scenario appears to be tricky.  If at all possible, using a zero as the data in the warehouse rather than a null should get the desired result for subtotaling, but a zero and a null are different, so this may be undesired.
The warehouse null cannot be forced to be a zero with the NullToZero() function because the value does not exist at all, so the Analytical Engine cannot pass it to the subtotal when other values are present.  The cells of warehouse nulls will display as a formatted 0, but the actual value of 0 is not there, so the Analytical Engine will pass the last displayed value to the subtotal.
 
TO LEARN MORE
For more information about non aggregating metrics, please refer to the Advanced Reporting Guide product manual in Chapter 2: Advanced Metrics, specifically the “Grouping options for nonaggregatable metrics” section.


Comment

0 comments

Details

Knowledge Article

Published:

April 10, 2017

Last Updated:

April 10, 2017