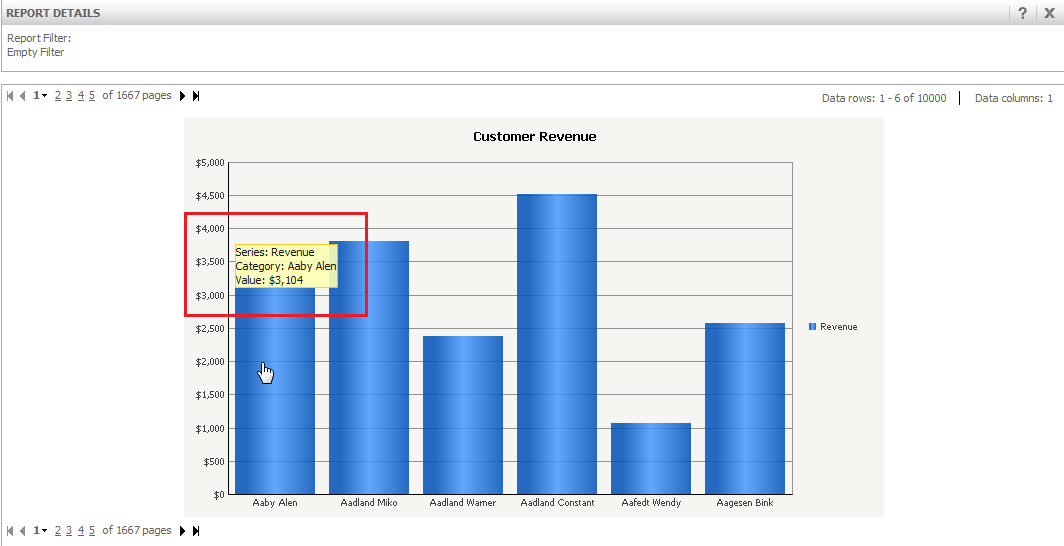
Tooltips are only visible in Web. However, both Strategy Developer and Web allow you to modify the tooltips displayed in a graph by using macros. These macros are dynamic text that is replaced with graph information when the tooltip is displayed in Graph View.
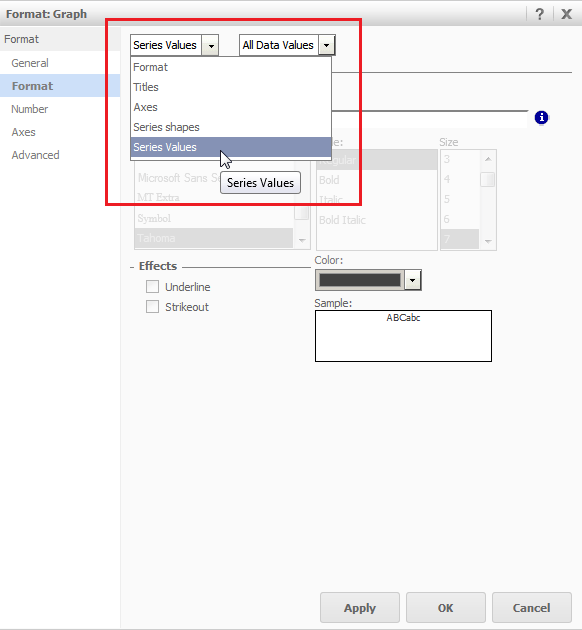
While the default macro used is {&TOOLTIP}, you can use different macros to customize what information appears in a given graph. You can use multiple macros in the same tooltip or combine static text and macros.
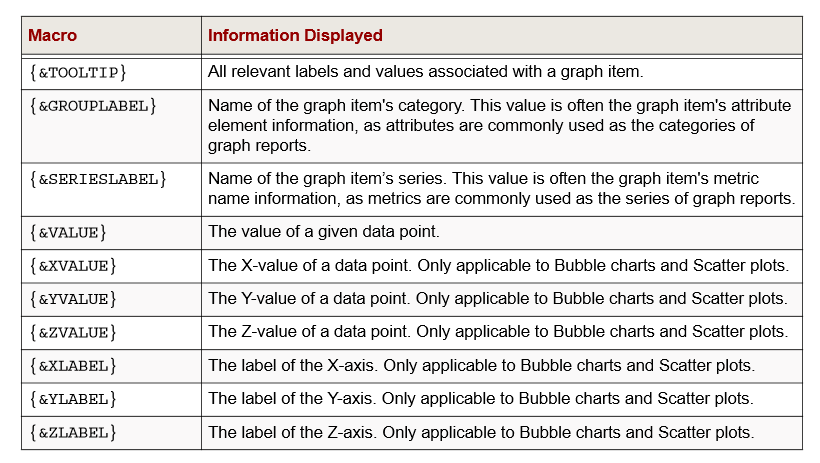
Some tooltip macros may not be available for use in specific types of graphs. For example, {&XVALUE} can only be used in Bubble charts or Scatter plots. If a macro is unavailable for the given graph type, no tooltip is displayed in the graph when viewed in Web.
The following table describes the macros you can use to customize graph tooltips in both Strategy Developer and Strategy Web:
Default:
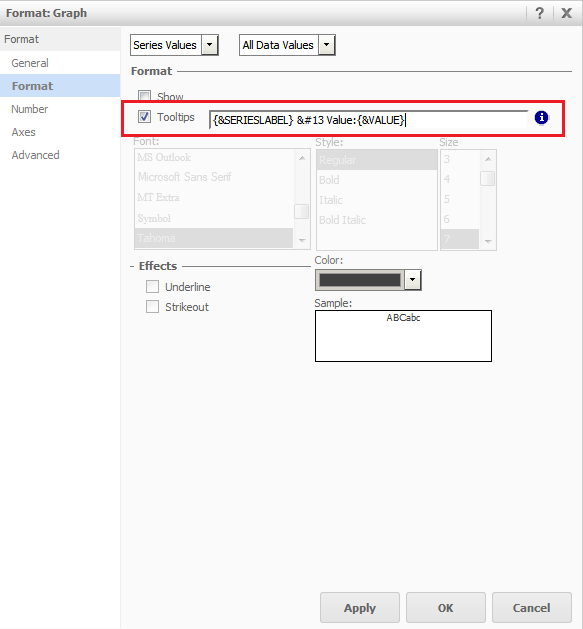
After:
