EducationSoftwareStrategy.com
StrategyCommunity

Knowledge Base

Product

Community

Knowledge Base

TopicsBrowse ArticlesDeveloper Zone

Product

Download SoftwareProduct DocumentationSecurity Hub

Education

Tutorial VideosSolution GalleryEducation courses

Community

GuidelinesGrandmastersEvents
x_social-icon_white.svglinkedin_social-icon_white.svg
Strategy logoCommunity

© Strategy Inc. All Rights Reserved.

LegalTerms of UsePrivacy Policy
  1. Home
  2. Topics

KB221162: Graphs as selectors do not indicate which attribute element has been selected in MicroStrategy Web 9.x.


Community Admin

• Strategy


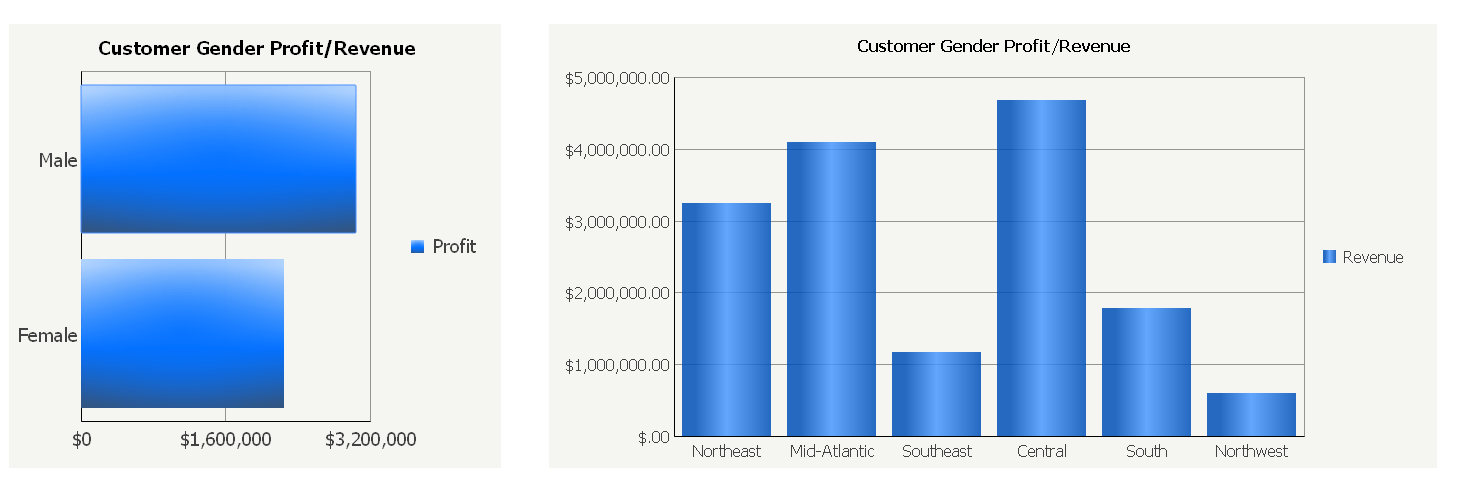
In MicroStrategy Web 9.x, when configuring a graph to be a selector for another graph, the attribute element will not be highlighted when selected

SYMPTOM:
In Strategy Web 9.x, when configuring a graph to be a selector for another graph, the attribute element will not be highlighted when selected. This could potentially result in users having difficulty knowing which attribute element was selected.
In the example below, the “Customer Gender” attribute is acting as a selector for the vertical bar graph on the right. Even though the “Male” attribute element is selected, there is no indicator to notify users of this selection.
ka04W000001MKquQAG_0EM4400000025nQ.jpeg

CAUSE:
This is a limitation in Strategy Web 9.x. A request has been logged to address this issue.
 
ACTION:
Strategy will continue to investigate and post updates as soon as they are available.
 
WORKAROUND:
There are two workarounds for this issue.

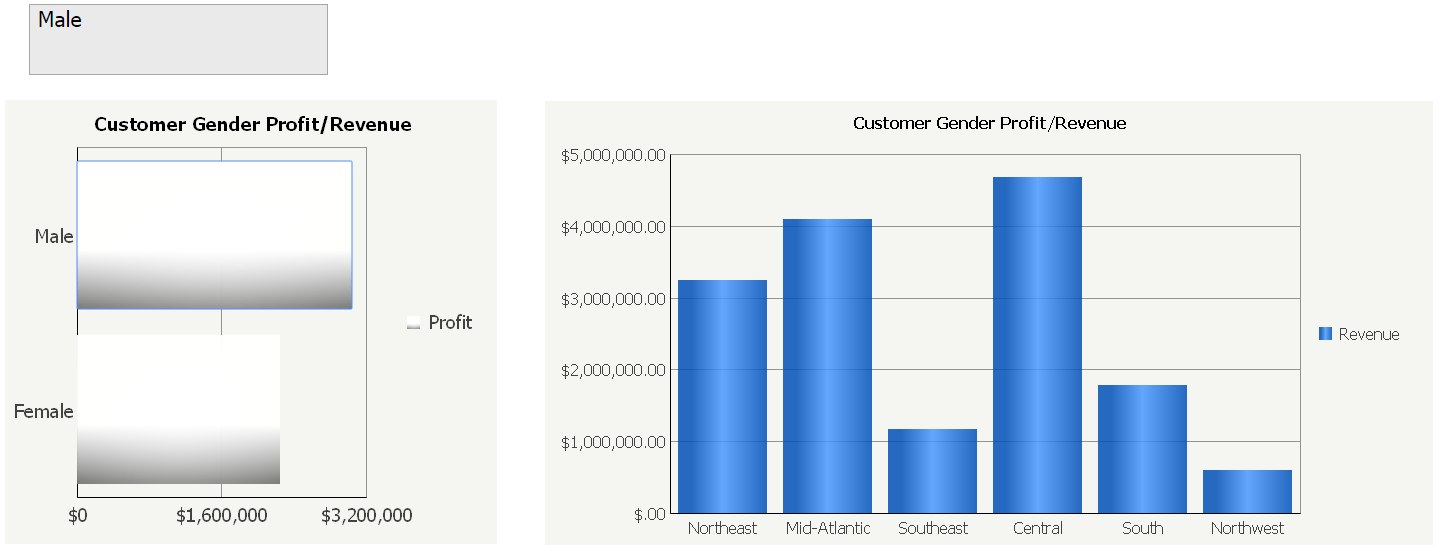
  • In Strategy Web 9.4.1, when changing the fill of the graph, users can notice that the selection is highlighted by a blue outline. Since the default fill color of the Vertical Bar graph is blue, this outline is not visible unless the fill color is changed. Change the fill color of the Vertical Bar graph to a color such as white, as shown below:
ka04W000001MKquQAG_0EM4400000025nR.jpeg
  •  Follow the steps below to create a text box with dynamic text that can be used to display the selected attribute element:
  • In a RS Document in Strategy Web 9.4.1, insert a panel stack with a text box.
  • Drag the attribute that is configured as a selector from the dataset objects pane to the text box to create a dynamic text.
  • Have the selector on the graph also target the panel stack with the text box.
  • Notice that whenever selections are made on the graph, the dynamic text in the text box changes to whatever attribute element was selected on the graph.
  • The dynamic text will show the attribute element that is selected on the graph, as shown below:
ka04W000001MKquQAG_0EM4400000025nc.jpeg


Comment

0 comments

Details

Knowledge Article

Published:

April 6, 2017

Last Updated:

April 6, 2017