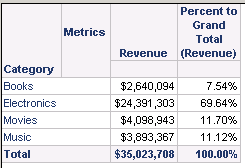
In some business scenario, it is required to create a metric that shows dynamic contributions (%) based on the subtotal when different items are selected. For example, in scenario1 below, item1 and item2 are selected in the selector, and their contributions are 60% and 40% respectively. But if item3 is also selected, as shown in scenario2 below, both item1 and item2’s contributions are reduced correspondingly to make an intact 100% when three items are added up.
Scenario1: item1 and item 2 are selected in the selector
Item Name Value Contribution
Item1 60 60%
Item2 40 40%
Total 100 100%
Scenario2: item1, item2 and item3 are selected in the selector
Item Name Value Contribution
Item1 60 50%
Item2 40 33%
Item3 20 17%
Total 120 100%
The article provides a method to achieve this requirement. The key points are: 1) create the Contribution (%) derived metric in the report instead of in the dashboard; 2) use filtering selector instead of slicing selector.