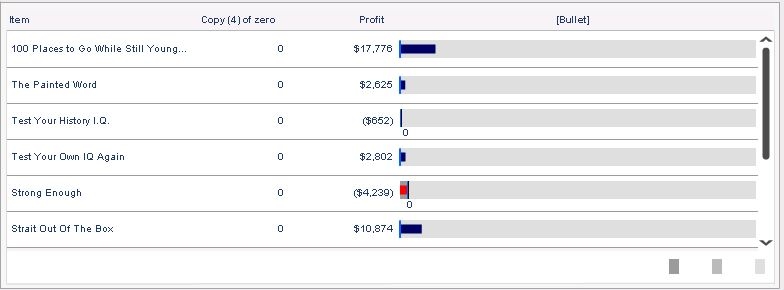
In some business scenario, it is needed to embed graphs into a grid column to make the grid more visualized. Just like the image below, the rightmost column is a horizontal bar graph where the length of the bar stands for the absolute value of each item’s profit, while red color represents positive value and green represents negative value.

This kind of grid can be created by combining a normal grid and a horizontal bar graph together. But it is usually very time-consuming to make everything aligned and make the combination natural. And if there are many rows of data, this combining method cannot achieve scroll bar effect.
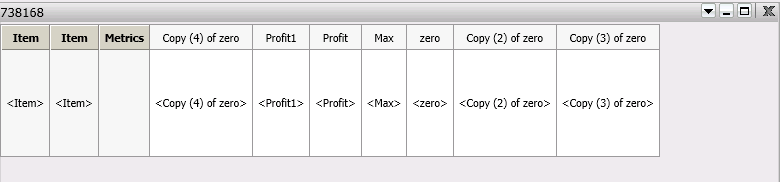
Microcharts Widget can be used to achieve this effect though. Below is the detailed steps about how to make use of bullet module in Microcharts Widget to generate a grid & horizontal bar graph combination: