EducationSoftwareStrategy.com
StrategyCommunity

Knowledge Base

Product

Community

Knowledge Base

TopicsBrowse ArticlesDeveloper Zone

Product

Download SoftwareProduct DocumentationSecurity Hub

Education

Tutorial VideosSolution GalleryEducation courses

Community

GuidelinesGrandmastersEvents
x_social-icon_white.svglinkedin_social-icon_white.svg
Strategy logoCommunity

© Strategy Inc. All Rights Reserved.

LegalTerms of UsePrivacy Policy
  1. Home
  2. Topics

KB221939: How to create a level metric to sum up all the attributes elements included in a custom group in MicroStrategy Developer


Community Admin

• Strategy


How to create a level metric to sum up all the attributes elements included in a custom group in MicroStrategy Developer.

In some business cases, customers want to create a metric to sum up all the attribute elements included in a custom group regardless of grouping by custom group elements. Below is a solution in Tutorial Project against Oracle database:
 

  1. Create a custom group with two rows, Call center in Boston, New York, Washington DC and region in Web;
  2. Create a filter with condition “Call Center In List (Boston, New York, Washington DC) OR Region In List (Web)”;
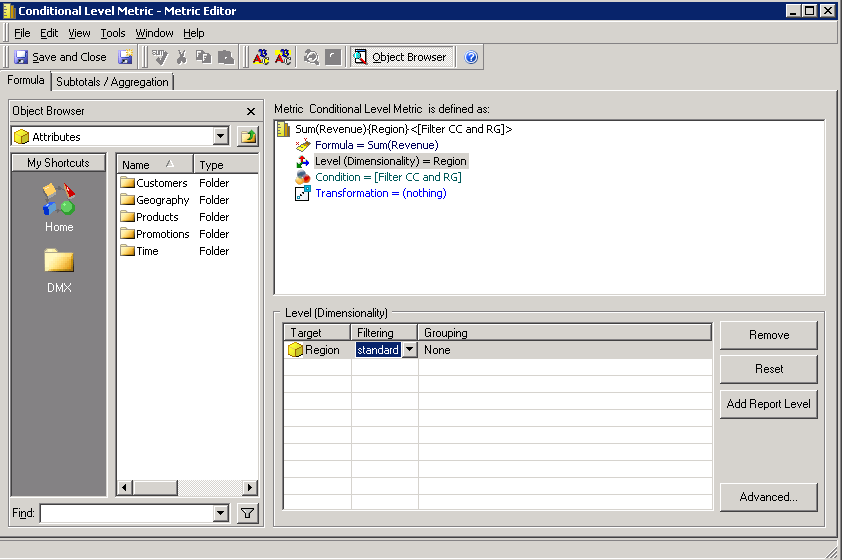
  3. Create a conditional Level metric. The expression is “Sum(Revenue)” at Region Level, the grouping option sets to be “None”, as shown below:


ka04W000000uGCZQA2_0EM440000002C7a.jpeg
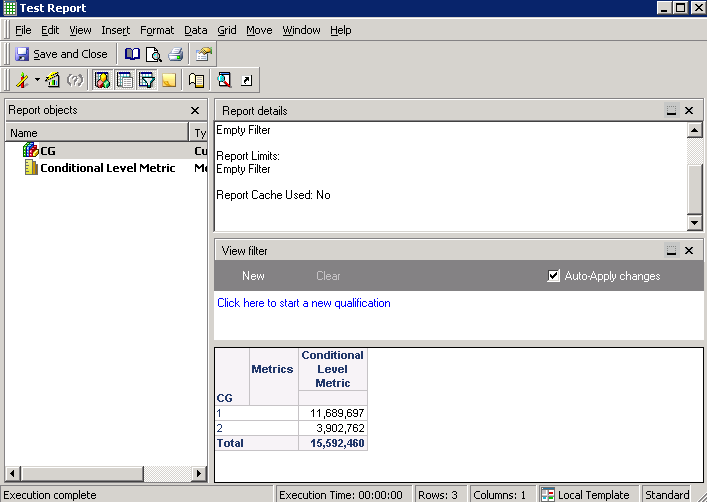
  1. Adding the custom group and the metric into a report, notice that metric still groups by custom group elements.
ka04W000000uGCZQA2_0EM440000002C7x.jpeg
  1. Then in metric editor, change the filtering option to be “ignore”, as shown below:
ka04W000000uGCZQA2_0EM440000002C7t.jpeg
  1. Run the report again and notice that this time the metric sums up all the regions.
ka04W000000uGCZQA2_0EM440000002C7w.jpeg
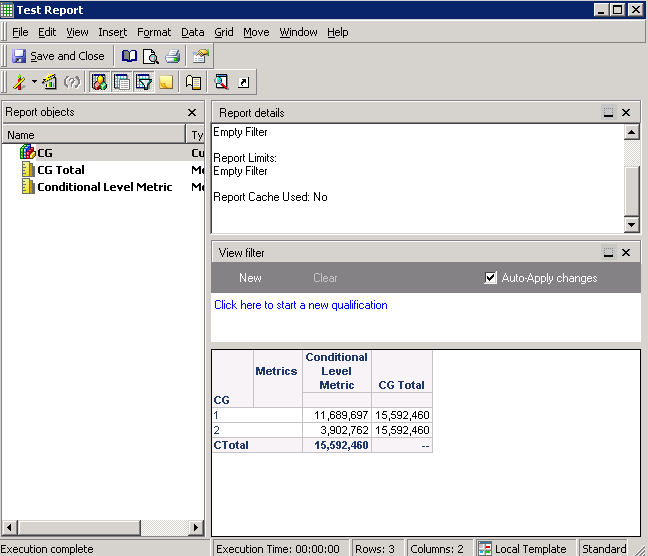
  1. Then create a level metric with ApplyAgg() function. The filtering option sets to be “ignore” and grouping option to be “None”, as shown below:
ka04W000000uGCZQA2_0EM440000002C7d.jpeg


ApplyAgg("sum(case when #1=12 then #0 when #2 in (5,11,12) then #0 else 0 end)", Revenue, Region@ID, [Call Center]@ID) {Region}
ka04W000000uGCZQA2_0EM440000002C7Y.jpeg
  1. Now the metric correctly sums up revenue of Call center in Boston, New York, Washington DC and region in Web, as shown below:
ka04W000000uGCZQA2_0EM440000002C7c.jpeg


KB221939


Comment

0 comments

Details

Knowledge Article

Published:

June 8, 2017

Last Updated:

January 3, 2019