SUMMARY
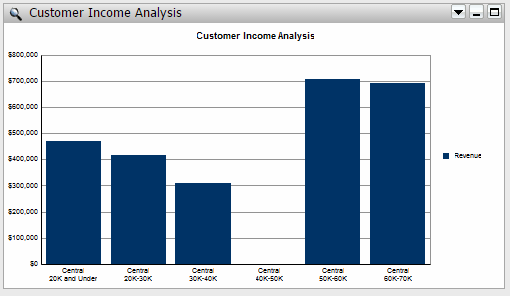
This article explains an issue when the bars in the bar graph disappear when values bigger than axes limit and solution.
SYMPTOM
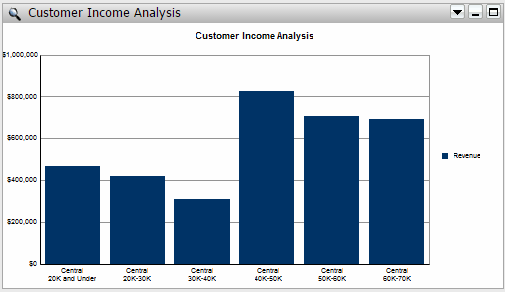
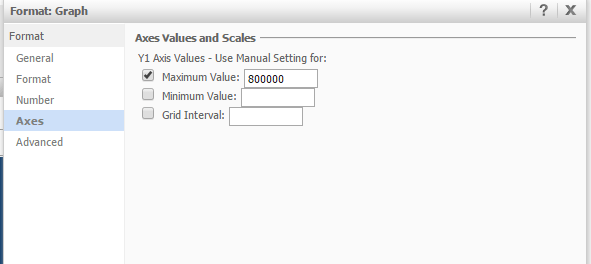
After applying axes limit, bars bigger than the axes limit disappear from the graph as below:
CAUSE
The setting "Off-scale Value Display" is set to "Hide Values". Off-scale Value Display determines how values that are outside the minimum or maximum values specified for a graph will be shown. The display options include:
ACTION
Go to the document editor from Strategy Developer, edit the Graph, then go to `Grids and Scales`>Axes>Y>Grids and Scales and change the setting "Off-scale Value Display" to "Clip Values" or "Show Values" based on your needs.
