EducationSoftwareStrategy.com
StrategyCommunity

Knowledge Base

Product

Community

Knowledge Base

TopicsBrowse ArticlesDeveloper Zone

Product

Download SoftwareProduct DocumentationSecurity Hub

Education

Tutorial VideosSolution GalleryEducation courses

Community

GuidelinesGrandmastersEvents
x_social-icon_white.svglinkedin_social-icon_white.svg
Strategy logoCommunity

© Strategy Inc. All Rights Reserved.

LegalTerms of UsePrivacy Policy
  1. Home
  2. Topics

KB226952: How to create a custom subtotal with values directly retrieved from warehouse instead of being calculated by Analytical Engine in MicroStrategy Analytics Developer 9.4.1?


Stefan Zepeda

Salesforce Solutions Architect • Strategy


There is a scenario where a custom subtotal needs to be displayed in a report, and the subtotal values should be retrieved from warehouse instead of calculated by Analytical Engine.

There is a scenario where a custom subtotal needs to be displayed in a report, and the subtotal values should be retrieved from warehouse instead of calculated by Analytical Engine. For example, there is a table as below in the warehouse:  
 

ka02R000000kc5WQAQ_0EM440000002C6Z.jpeg

It is required that the subtotal MTD and YTD are displayed as the values stored in the warehouse, i.e., 5 and 7 respectively for GROUP1, and 6 and 3 for GROUP2.
This knowledge base article provides a workaround to achieve this requirement. Below are the detailed steps of the workaround:
  • Create a filter “Total only”: PLANT in list (TOTAL)
  • Create a condition metric “Total Sum MTD” with above filter to display only the Total value: Sum(MTD) {~} <[Total only]; @2; ->
  • Create a filter “Total excluded”: PLANT not in list (TOTAL)
  • Create a condition metric “Sum MTD” with above filter to exclude the Total value: Sum(MTD) {~} <[Total excluded]; @2; ->
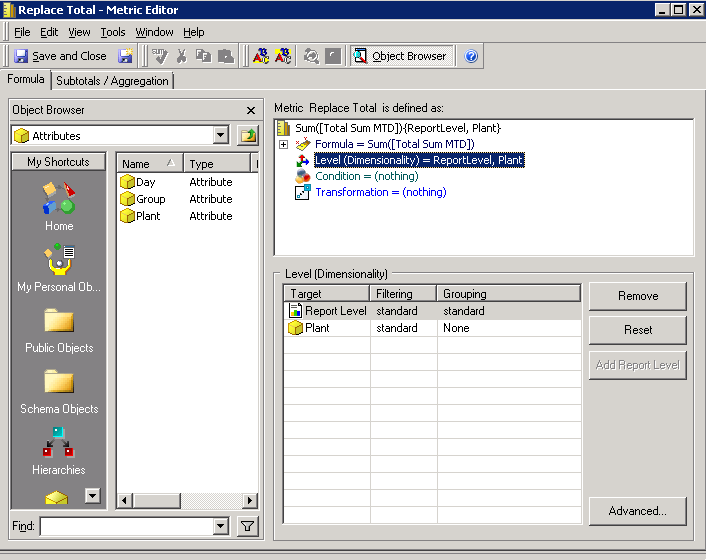
  • Create a new standalone metric “Replace Total”: Sum([Total Sum MTD]) {~, Plant}
  • Add a Dimension Plant, with standard filtering and none grouping rules:
ka02R000000kc5WQAQ_0EM440000002C6X.jpeg
  • Create a subtotal “Subtotal MTD Replace”: Max(Sum([Replace Total])
ka02R000000kc5WQAQ_0EM440000002C6V.jpeg
  • Associate the subtotal with metric “Sum MTD”
ka02R000000kc5WQAQ_0EM440000002C6T.jpeg
  • Create a report with DAY, GROUP, PLANT, and metrics Sum MTD, and Replace Total. Set the two metrics outer join
  • Run the report, add a new subtotal as below:  
ka02R000000kc5WQAQ_0EM440000002C6k.jpeg
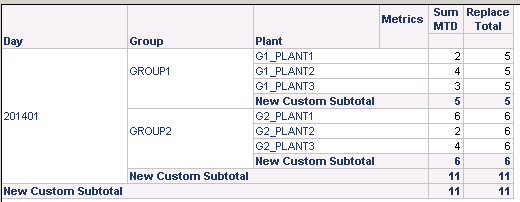
  • The report output is as below, where subtotal values are using Replace Total metric values that are directly retrieved from the warehouse:  
ka02R000000kc5WQAQ_0EM440000002C6e.jpeg
  • The metric Replace Total can be hidden by setting its column size as 0 in Grid Options

For the metric YTD, it is the same strategy - create a Replace Total metric first to only retrieve the value of true YTD Total in the warehouse, then create a subtotal that uses this Replace Total metric in the definition.


Comment

0 comments

Details

Knowledge Article

Published:

May 30, 2017

Last Updated:

May 30, 2017