EducationSoftwareStrategy.com
StrategyCommunity

Knowledge Base

Product

Community

Knowledge Base

TopicsBrowse ArticlesDeveloper Zone

Product

Download SoftwareProduct DocumentationSecurity Hub

Education

Tutorial VideosSolution GalleryEducation courses

Community

GuidelinesGrandmastersEvents
x_social-icon_white.svglinkedin_social-icon_white.svg
Strategy logoCommunity

© Strategy Inc. All Rights Reserved.

LegalTerms of UsePrivacy Policy
  1. Home
  2. Topics

KB230547: How to create a cluster analysis report in MicroStrategy Enterprise Manager 9.x?


Community Admin

• Strategy


How to create a cluster analysis report in MicroStrategy Enterprise Manager 9.x?

This technical note explains how to create a cluster analysis report in Strategy Enterprise Manager 9.x.
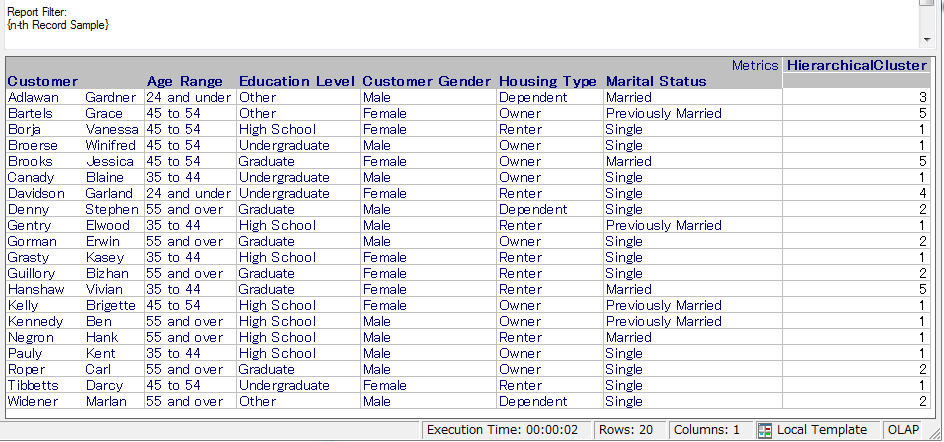
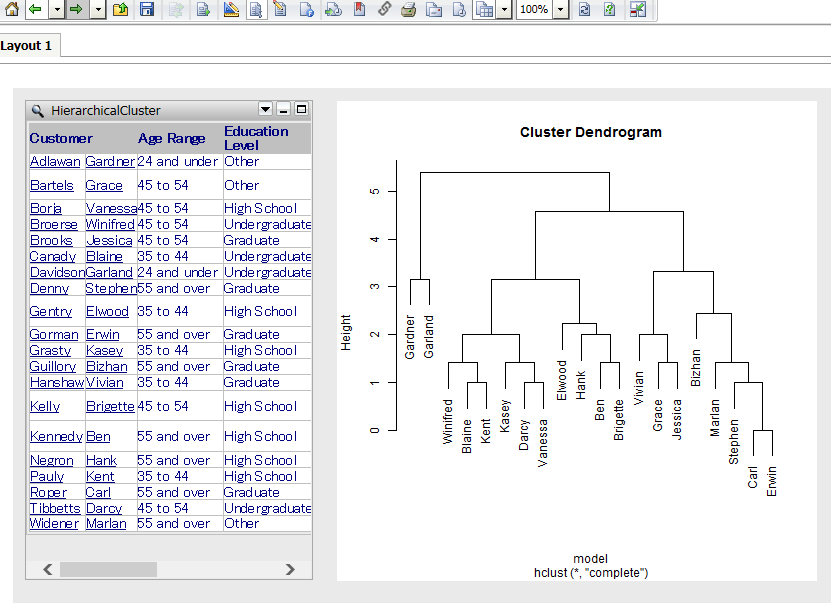
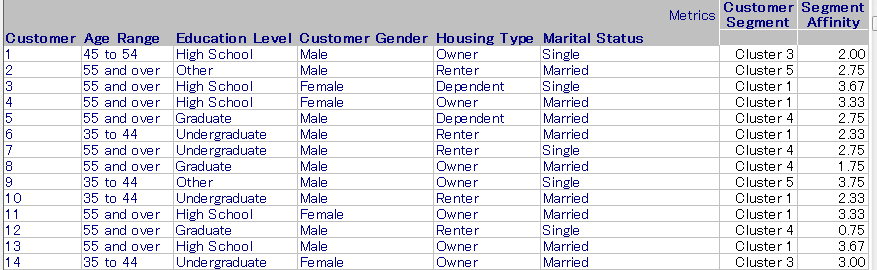
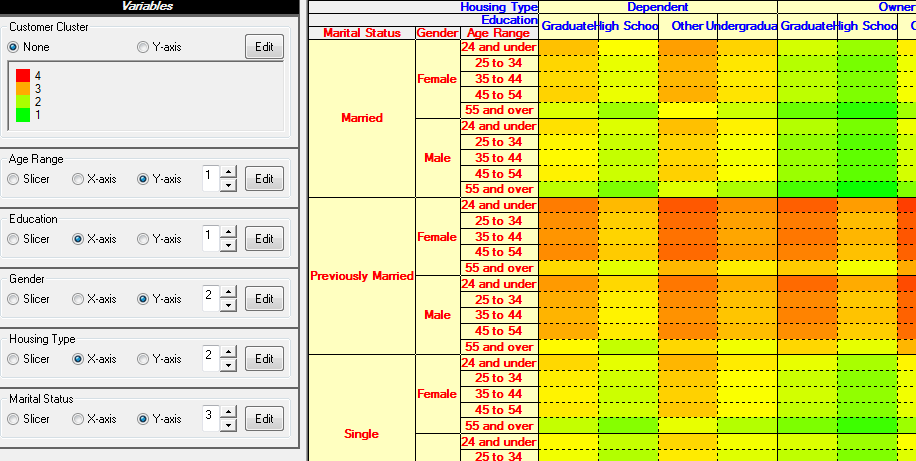
The out-of-the-box sample report is included in the Tutorial Project under \Public Objects\Reports\Strategy Platform Capabilities\Strategy Data Mining Services\Cluster Analysis. The segmentation is seen in a report and the result of the model is seen in the predictive view model in a graphical way as shown in the image below. The K-Means algorithm is used in the predictive metric.
 

ka04W000000OhZMQA0_0EM4400000029HK.jpeg


ka04W000000OhZMQA0_0EM4400000029HJ.jpeg

 
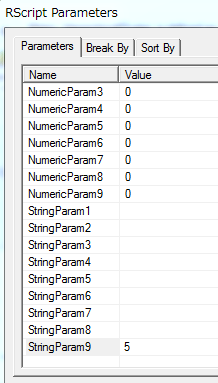
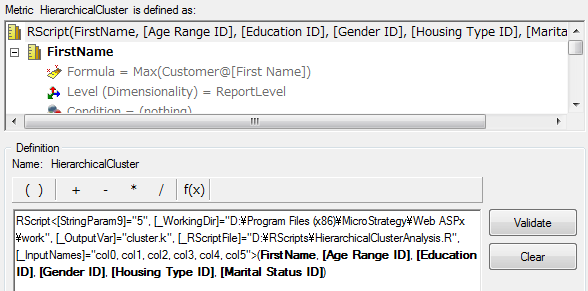
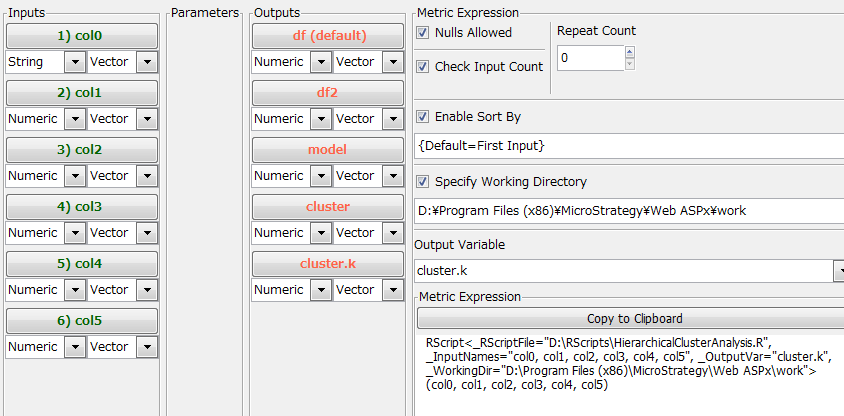
User may want to use hierarchical clustering approaches. The following steps show how to create a hierarchical cluster report using R with the Tutorial Project.
 

  • Create the independent metrics for Customer attribute, and the metric to show customer’s first name in a dendogram.
    First Name: Max(Customer@[First Name]) {~+}
    Age Range ID: Max([Age Range]@ID) {Customer+, ~+}
    Education ID: Max([Education Level]@ID) {Customer+, ~+}
    Gender ID: Max([Customer Gender]@ID) {Customer+, ~+}
    Housing Type ID: Max([Housing Type]@ID) {Customer+, ~+}
    Marital Status ID: Max([Marital Status]@ID) {Customer+, ~+}
     
  • Create an R Script as follows:
    
    #Get the data
    if(exists("mstr.ExFlag")) { 
    #If this is executed by Strategy
     df <- data.frame(cbind(col0, col1, col2, col3, col4, col5))# data frame from the input variables   
     rownames(df) <- df[, 1]        # Input row name from the first column
     df2 <- df[ ,-1]                # Delete the first column.
     rownames(df2) <- rownames(df)  # Set the row name
    } else {                                                     
    #If this is NOT via a Strategy Report Execution
    df<- matrix(c(1,2,3,4,1,2,3,4,1,2,3,4,1,2,3,4), nrow=4, ncol=4)
        rownames(df)<-c("A","B","C","D")
        numofclusters="5"
    }
    #Modeling
    model <- dist(df2)        # distance matrix
    cluster <- hclust(model, method="complete")   #complete linkage 
    cluster.k <- cutree(cluster, k=numofclusters) # cut tree into the number of clusters  
    png("../Images/hc.png")   # the device to save a png image
    plot(cluster)             # draw dendogram
    dev.off()                 # close the device
    

  • Open the script in a deployR tool and generate the metric expression by editing the parameters as shown in the image below: 
ka04W000000OhZMQA0_0EM4400000029HU.jpeg
  • Add the following line between the #Strategy_BEGIN and #Strategy_END lines in the script.
    
    #RVAR numofcluster -parameter StringParam9

     
  • Create a metric with the expression at Step_3 and right-mouse click ‘RScript’ in the expression to open RScript Parameters. Input the number of clusters to be segmented in the value of StringParam9, as shown in the image below:
ka04W000000OhZMQA0_0EM4400000029HS.jpeg
  • Replace the input parameters with the metrics created in Step_1 as shown in the image below:
ka04W000000OhZMQA0_0EM4400000029HM.jpeg
  • Create a report with the following attributes and the metric. Add the out-of-the-box, ‘n-th Record Sample’ filter to the report.
    Customer
    Age Range
    Education Level
    Customer Gender
    Housing Type
    Marital Status
     
  • The report with sample 20 records shows 5 clusters as specified in the parameter at Step_6.
ka04W000000OhZMQA0_0EM4400000029Hf.jpeg
  • Create a Report Service document and specify the image outputted from R Script to see a dendrogram.
ka04W000000OhZMQA0_0EM4400000029HV.jpeg


Comment

0 comments

Details

Knowledge Article

Published:

May 15, 2017

Last Updated:

May 15, 2017