This technical note outlines a known issue in graph formatting that may distort graph appearance when metric values are very small (<0.005).
When selecting the "Disable fractional grid lines" option under Graph Preferences > Axes > Y and when using any of the vertical bar graph types, the bars may entirely disappear from the graph view. The graph preview of the different state of each setting is shown in the bottom left corner of the following screenshots:

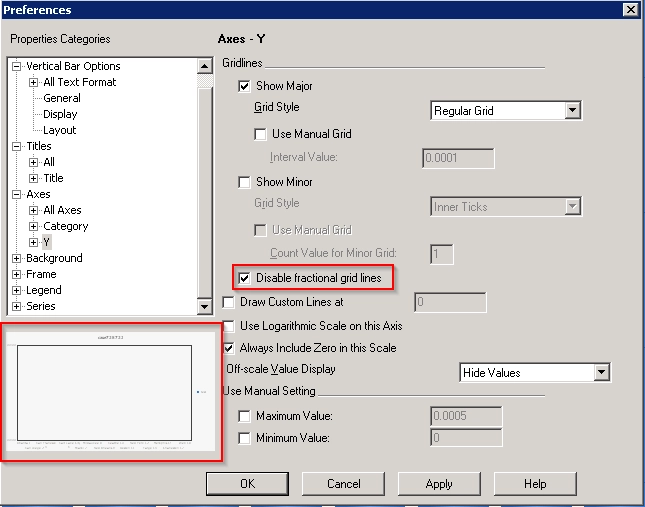
By default, when selecting the "Disable fractional grid lines" setting, the maximum Y-axis value will be rounded up to the next whole number. For small metric values, this can distort the graph display.
Strategy will continue to investigate and post updates as soon as they are available.
Before checking the "Disable fractional grid lines" setting, check the "Maximum Value" check box under Use Manual Setting below the "Disable fractional grid lines" setting.
