EducationSoftwareStrategy.com
StrategyCommunity

Knowledge Base

Product

Community

Knowledge Base

TopicsBrowse ArticlesDeveloper Zone

Product

Download SoftwareProduct DocumentationSecurity Hub

Education

Tutorial VideosSolution GalleryEducation courses

Community

GuidelinesGrandmastersEvents
x_social-icon_white.svglinkedin_social-icon_white.svg
Strategy logoCommunity

© Strategy Inc. All Rights Reserved.

LegalTerms of UsePrivacy Policy
  1. Home
  2. Topics

KB234823: The color of a graph in exported excel file from dashboard is different with the one when viewing in MicroStrategy Web.


Community Admin

• Strategy


The color of a graph in exported excel file from dashboard is different with the one when viewing in MicroStrategy Web.

STEPS TO REPRODUCE:
Test environment: Strategy 941 Hotfix 7, Microsoft Office 2013
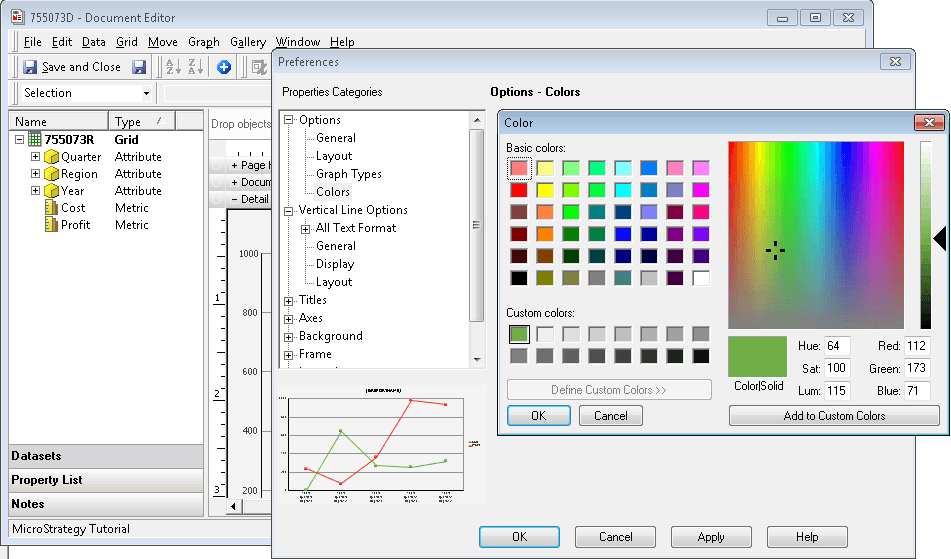
  • Create a report with attribute “Year”,”Quarter”, “Region” and metrics “Profit”,”Cost” in Tutorial Project.
  • Create a document based on above report. And choose “Vertical Line” as graph type for the grid.
  • In Developer, edit the document and set the color using below value:
ka04W000000OdbbQAC_0EM4400000025jK.jpeg
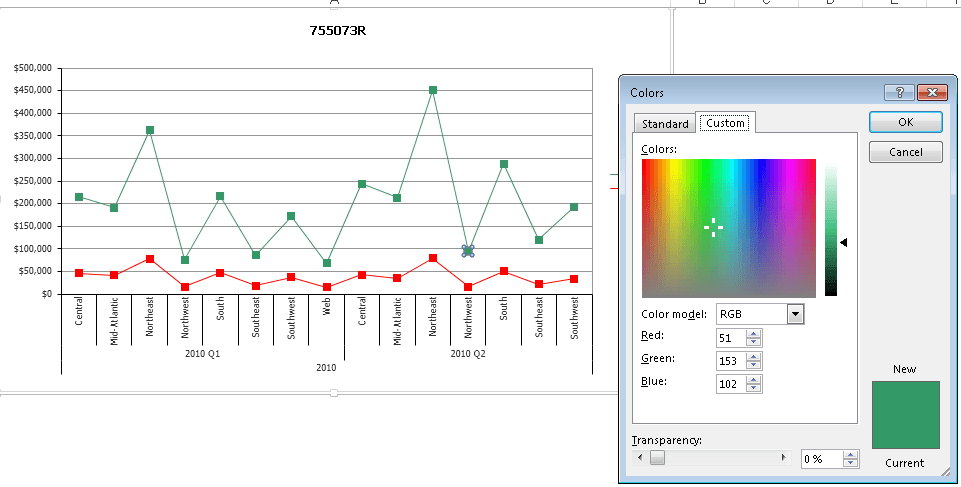
  • Export the document to excel from Web. And in exported excel, it is seen that the color is changed, as following:
ka04W000000OdbbQAC_0EM4400000025jM.jpeg

 
CAUSE:
A possible cause is that the preference in export options in Web is set as "Excel XP/2003", as following:
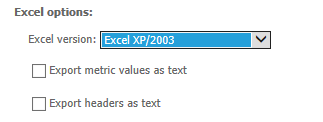
ka04W000000OdbbQAC_0EM4400000025jI.jpeg

ACTION:
Change the export options from "Excel XP/2003" to "Excel 2007 or newer" and export again, user will see correct color in exported excel file, as following:
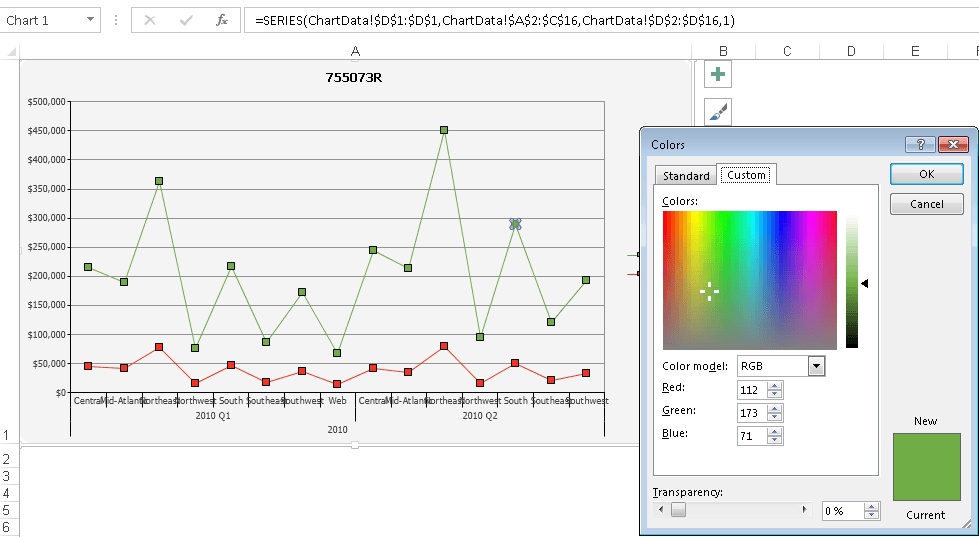
ka04W000000OdbbQAC_0EM4400000025jJ.jpeg

Comment

0 comments

Details

Knowledge Article

Published:

June 14, 2017

Last Updated:

June 14, 2017