SUMMARY
This issue has been classified as a defect by Strategy. The impact is limited to information windows on ESRI maps in the Strategy 9.4.1 product. There is a workaround available in the current document. A solution/code fix for this issue is not available in current releases but is being reviewed for a future Strategy release.
SYMPTOM
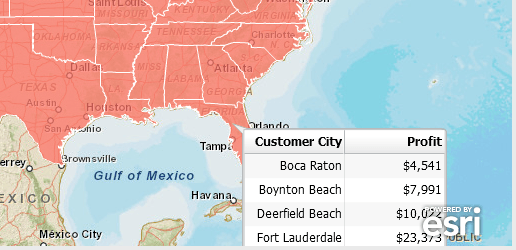
A user has created an ESRI map using areas. If the user clicks an area, an information window will display. There will not be a scroll bar on the information window. If the information window is too long to display on the ESRI Map, some of the rows will be cut off.
STEPS TO REPRODUCE
1. In the Strategy Tutorial project, create a report with the Customer State and Customer City attributes and the Profit metric
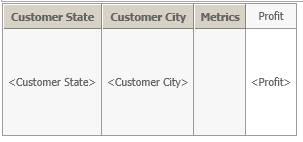
2. Create a document and add the report as a grid
3. Configure the grid to run as an ESRI map
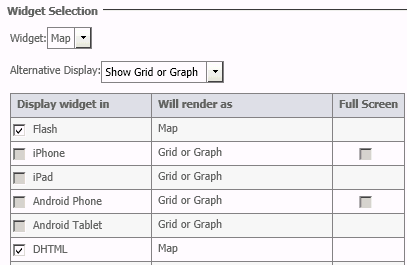
4. In the map properties, select Show areas, for the attribute select Customer State and for the Shape File select US States Names

5. Run the document in Flash mode
6. Click the state of Florida. The grid will display as an information window. The grid is too long to display in the ESRI map and there is no scroll bar to see the extra rows.
CAUSE
This is an identified defect in Strategy 9.4.x. and above. Currently this issue is still being reviewed for feasibility by our Technology team for a potential code fix on an upcoming Strategy release.
WORKAROUND
As a workaround, the user may click outside of the area map and use the hand icon to change the view of the ESRI map

This will allow the entire information window to be seen
TO LEARN MORE
KB45064: How to activate Cloud based ESRI for Strategy Analytics Enterprise 9.4.1.
KB46526: What are the connection requirements and data flow for the ESRI Maps in Strategy Web
KB46182: How to set up ESRI and Google Maps when updating to Strategy Analytics Enterprise 9.4.1
KB236726
