SYMPTOM
A visualization can be set to filter other visualizations on a Visual Insight dashboard in Strategy Web 9.3.1. If the visualization is set to filter targets when selecting elements of a Custom Group, the dashboard will render as a blank white screen after execution. This can be seen in the screenshot below.
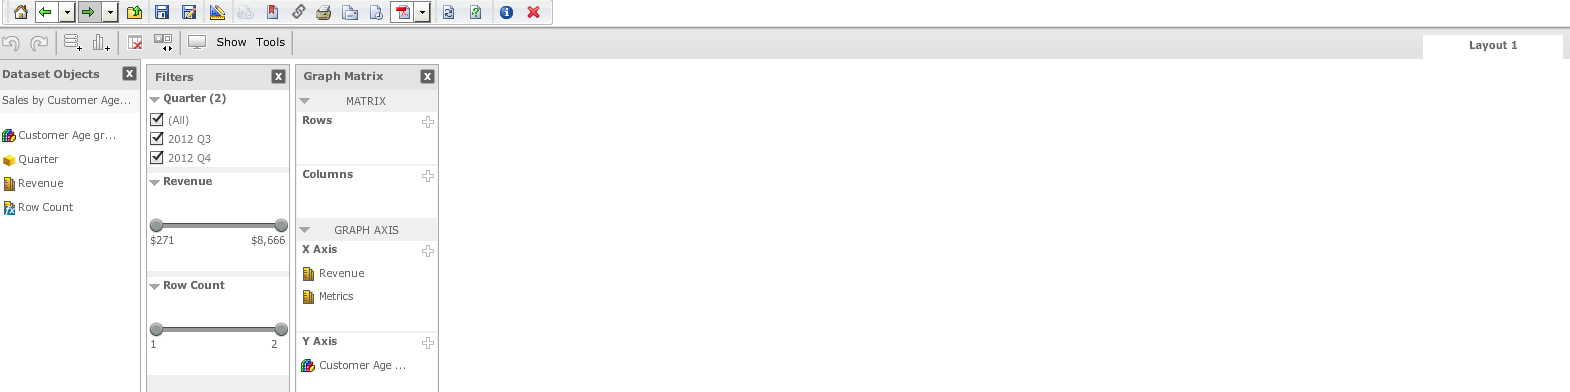
STEPS TO REPRODUCE
CAUSE
This is a known issue in Strategy Web 9.3.1.
ACTION
Currently this issue is still being reviewed for feasibility by our Technology team and it is not scoped for any upcoming scheduled Strategy release.
This issue has been logged with Strategy internal reference number 1014714.