Overview
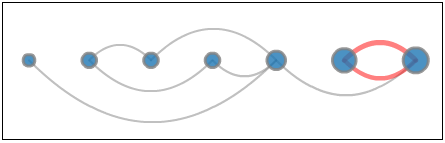
The Network widget allows you to quickly and easily identify relationships between related items and clusters, such as when visualizing a social network or displaying a market basket analysis. Attribute elements are displayed as nodes in the widget, with lines (called edges) drawn between the nodes to represent relationships between elements. Once the widget is created, users can visualize characteristics of the nodes and the relationships between them, using display options such as node size, edge thickness, and edge color. This technical note describes the details of the Network widget with a sample data.
Widget Design
Attributes
In order to display edges between nodes in the widget, you must place attributes on the Grid/Graph to provide the starting and ending nodes for each edge you want to display. Each row of data in the Grid/Graph corresponds to a separate edge in the widget. Place two attributes on the Grid/Graph’s rows, as follows:
- The elements of the first attribute are displayed as nodes that serve as the starting location for each edge in the widget.
- The elements of the second attribute are displayed as nodes that serve as the ending location for each edge in the widget.
Metrics
Three metrics on the Grid/Graph’s columns are required and each metric represents the following widget characteristics:
- The first metric is used to automatically size edges in the widget, with larger metric values represented by thicker edges.
- The second metric is used to automatically color edges in the widget. To do this, you must define a threshold to change the color in which the data in the Grid/Graph is displayed based on the value of the metric.
- The third metric is used to automatically size nodes in the widget, with larger metric values represented by larger nodes.
Sample Data
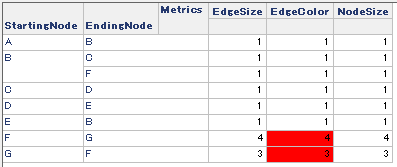
In this technical note, a bigram, N-gram(2), is obtained from the following sequence of words and a Strategy report is implemented based on the result of the bigram. As a simple example, a threshold is applied on the Edge Color metric and those elements whose values are greater than 1 are in red (fill color).
Sequences of words
A B C D E B F G F G F G F G
Strategy Report
Demonstration
The bigram for the sequence of words “A B C D E B F G F G F G F G” is presented in the Network widget as shown below (A → B → C → D → E → B → F ⇔ G).
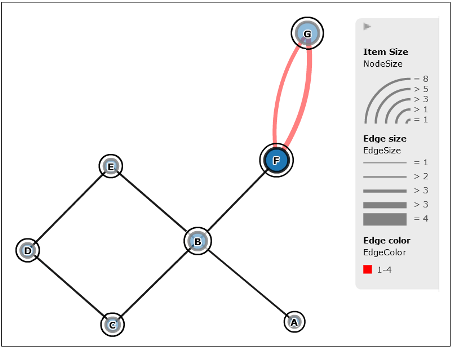
* The picture above is modified manually to present each node clearly
<Node Size>
The size of node B, F, and G are relatively bigger than the other nodes. This is because the node size is the sum of all edges (3rd metric) to which a node is connected.
<Edge Size and Color>
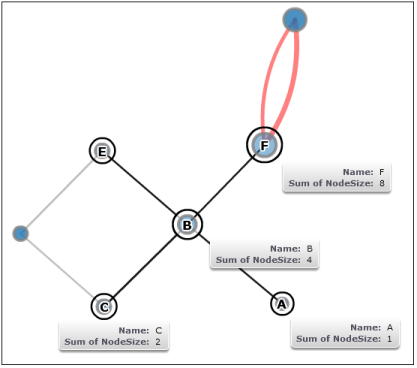
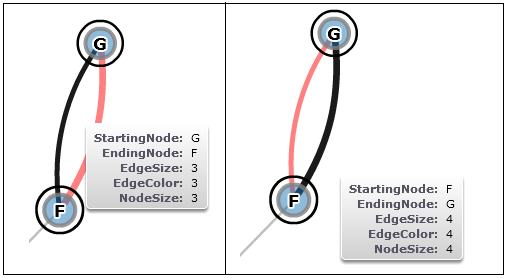
Mouse-over tooltips display the details of every attribute and metric. The edge size varies depending on the value of the 1st metric and the color reflects the thresholds defined on the 2nd metric.
<Layout Options>
Within the widget, users can choose one of the three layout options.
Force-directed Layout

Circular Layout

Linear Layout