D3 Visualization is supported starting from Strategy. Users can take advantage of D3’s features and several of its wrapper libraries for making visualizations on VI Dashboards and Report Service documents .The following Strategy SDK sample code demonstrates a zoom-able Heatmap by integrating a D3 Visualization in a Visual Insight Dashboard in Strategy Web.
A Heatmap visualization is an easy way to compare the categories. The attributes are categorized by color and the metric values are represented by the rectangle size.
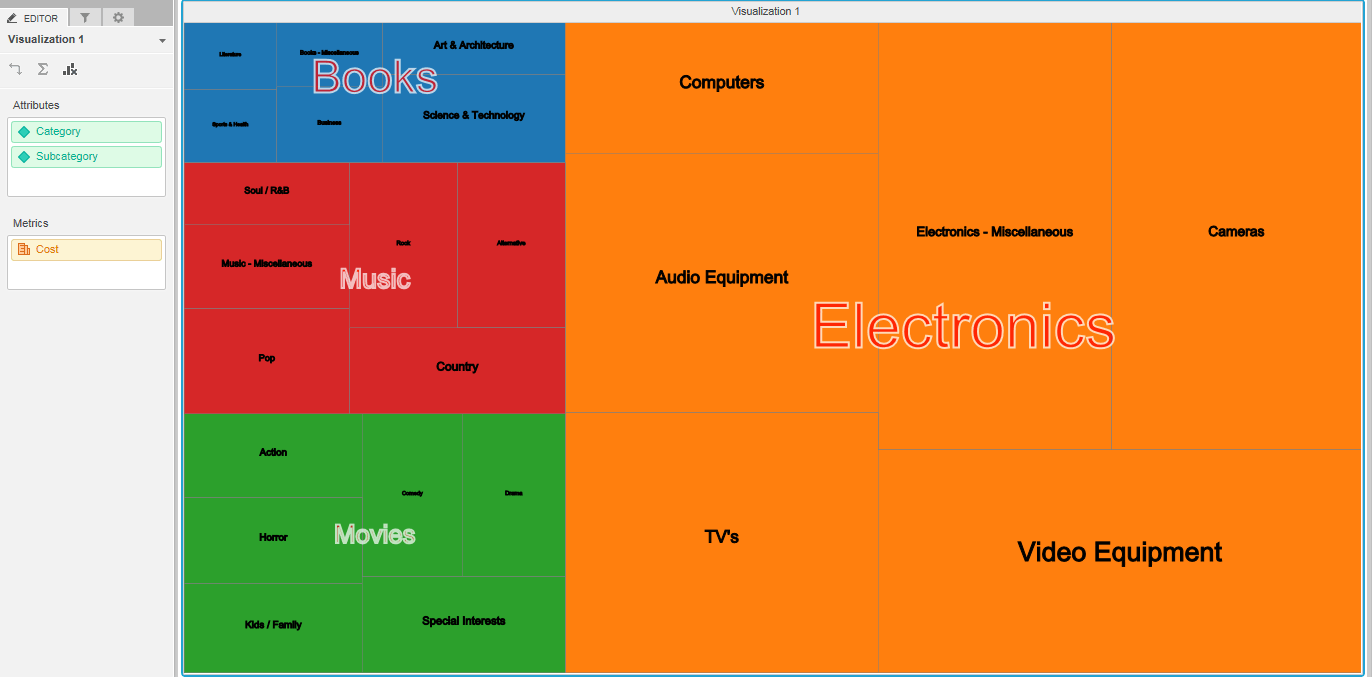
By clicking on the ‘Books’ category, it is zoomed in as shown in the image below:

The code of this visualization:
/**
 * Zoomable heatmap for D3 visualizaiton on VI dashboard
 */
(function () {
    // Define this code as a plugin in the mstrmojo object
    if (!mstrmojo.plugins.MstrVisTest1) {
        mstrmojo.plugins.MstrVisTest1 = {};
    }
    // All mojo visualization require the CustomVisBase library to render
    mstrmojo.requiresCls("mstrmojo.CustomVisBase",
                         "mstrmojo.models.template.DataInterface"
                        );
    // Declare the visualization object
    mstrmojo.plugins.MstrVisTest1.MstrVisTest1 = mstrmojo.declare(
        // Declare that this code extends CustomVisBase
        mstrmojo.CustomVisBase,
        null,
        {
            // Define the JavaScript class that renders your visualization as mstrmojo.plugins.{plugin name}.{js file name}
            scriptClass: 'mstrmojo.plugins.MstrVisTest1.MstrVisTest1',
            externalLibraries: [{url: "http://d3js.org/d3.v3.min.js"}],
            plot: function () {
 	            console.log("ZoomTree:starting...");

                var $D1 = mstrmojo.models.template.DataInterface,
                    normalizedModel = (new $D1(this.model.data)).getRawData($D1.ENUM_RAW_DATA_FORMAT.DATA_FORMAT_ROWS);


                var width = parseInt(this.width, 10),
                    height = parseInt(this.height, 10),
                    color = d3.scale.category10(),
                    transitionDuration = 750;

                var element;

                var svg = d3.select(this.domNode).select("svg");

                if (svg.empty()) {
                    svg = d3.select(this.domNode).append("svg")
                        .attr("class", "ZoomTree");
                }

                svg.attr("width", width)
                    .attr("height", height);

                var treemap = d3.layout.treemap()
                    .size([width, height])
                    .value(function(d) { return d.formattedValue ? new String(d.formattedValue).match(/[\d\.]/g).join("") : null;})
                    .children(function(d) { return d.children; });


                var nodes = treemap.nodes(normalizedModel);
	            console.log(nodes);

                display();

                function display(){

	               element = svg.selectAll("g")
                                .data(nodes)
	                            .enter().append("g")
	                            .attr("class","treemap")
                                .on("click", function(d ,i) {zoom(d);});

                    // draw the rectangles
                    element.append("rect")
                    .call(rect);
                    // append the text
                    element.append("text")
                    .call(text);

                    // draw a grouping text
                    var array1 = [];
                    var grouparea;
                    var lastElement;
                    element.each(function(d){ lastElement = d; });
                    element.each(function(d){
                        var org;
                        if(!d.children && org === d.parenrt && d !== lastElement){
                            array1.push(d);
                            console.log(d);
                        }else if (array1.length != 0){
                            org = d.parenrt;
                            if(d === lastElement) {array1.push(d);};
                            grouparea = calarea(array1);
                            d3.select(this).append("text")
                            .attr("x",grouparea.minX + ((grouparea.maxX+grouparea.maxXWidth)-grouparea.minX)/2)
                            .attr("y",grouparea.minY + ((grouparea.maxY+grouparea.maxYHeight)-grouparea.minY)/2)
                            .text(array1[0].parent.name)
                            .attr("stroke","white")
                            .attr("stroke-width",2)
                            .attr("fill","red")
                            .attr("text-anchor","middle")
                            .attr("font-size", grouparea.maxXWidth/4)
                            .attr("opacity", 0.7)
                            .attr("class", "gText");
                            array1 = [];
                        }else{
                            array1 = [];
                        }
                    });

                }


                function calarea(ar){
                    var minX, minY, maxX, maxY, maxXWidth, maxYHeight;
                        minX = maxX = ar[0].x;
                        minY = maxY = ar[0].y;
                        maxXWidth = ar[0].dx;
                        maxYHeight = ar[0].dy;
                    for(var i=1; i < ar.length; i++){
                        if(minX > ar[i].x) {minX = ar[i].x;}
                        if(minY > ar[i].y) {minY = ar[i].y;}
                        if(maxX < ar[i].x) {maxX = ar[i].x; maxXWidth = ar[i].dx;}
                        if(maxY < ar[i].y) {maxY = ar[i].y; maxYHeight = ar[i].dy;}
                    }

                    var obj = { "minX": minX, "minY": minY, "maxX": maxX, "maxY": maxY, "maxXWidth": maxXWidth, "maxYHeight": maxYHeight };
                    return obj;
                }


                function rect(rect) {
                    rect.attr("x", function(d){ return d.x; })
                        .attr("y", function(d){ return d.y; })
                        .attr("width", function(d){ return d.dx; })
                        .attr("height", function(d){ return d.dy; })
                        .attr("fill",function(d){ return d.children ? null : color(d.parent.name); })
                        .attr("stroke", "gray")
                        .attr("stroke-width",0.5);
                }

                function text(text) {
                    text.attr("x", function(d){ return d.x + (d.dx/2); })
                        .attr("y", function(d){ return d.y + (d.dy/2); })
                        .attr("text-anchor","middle")
                        .attr("font-size", function(d){return d.dx/18;})
                        .text(function(d){ return d.children ? "" : decodeHTML(d.name); })
                        .attr("stroke", "black");

                   function decodeHTML(text) {
                        return text.replace(/&#(\d+);/g, function (match, dec) {
                            return String.fromCharCode(dec);
                        }).replace(/&/g, '&');
                    };
                }


                function zoom(d){

                    if(svg.select("g").attr("class") == "ext"){
                        // reset the screen;
                        element.remove();
                        display();
                        return;
                    };

                    // filter with the children which has the same parent
                    var area = element.filter(function(x) {return d.parent === x.parent;});
                    // The other area
                    var areaOther = element.filter(function(x) {return d.parent !== x.parent;});

                    area.attr("class", "ext");  // update the class name for the zoomed area
                    area.attr("opacity", 0.4);
                    areaOther.attr("opacity", 0.1);

                    // Obtain the coodinates of the selected area
                    var minX, minY, maxX, maxY, maxXWidth, maxYHeight, flg = false;
                    var areaRect = area.selectAll("rect").each(function(d){
                        if (!flg) {
                            minX = maxX = d.x;
                            minY = maxY = d.y;
                            maxXWidth = d.dx;
                            maxYHeight = d.dy;
                            flg = true;
                        }
                        if(minX > d.x) {minX = d.x;}
                        if(minY > d.y) {minY = d.y;}
                        if(maxX < d.x) {maxX = d.x; maxXWidth = d.dx;}
                        if(maxY < d.y) {maxY = d.y; maxYHeight = d.dy;}
                    });

                    // zoom-in
                    areaRect.transition().duration(transitionDuration)
                        .attr("transform","scale(" + width/((maxX+maxXWidth)-minX) + "," + height/((maxY+maxYHeight)-minY) + ")translate(" + -1*(minX) + "," + -1*(minY) + ")");

                    // move
                    var areaText = area.selectAll("text");
                    areaText.transition().duration(transitionDuration).each(function(d) {
                        d3.select(this).attr("x", (d.x + (d.dx/2) - minX)*(width/((maxX+maxXWidth)-minX)))
                                        .attr("y", (d.y + (d.dy/2) - minY)*(height/((maxY+maxYHeight)-minY)))
                                        .attr("font-size", function(d){return d.dx*(width/((maxX+maxXWidth)-minX))/18;});
                    });

                    var gText = area.selectAll(".gText");
                    gText.remove();

                    area.transition().duration(transitionDuration).attr("opacity", 1.0);
                    areaOther.transition().duration(transitionDuration).remove();

                }

            }
        });
})();