EducationSoftwareStrategy.com
StrategyCommunity

Knowledge Base

Product

Community

Knowledge Base

TopicsBrowse ArticlesDeveloper Zone

Product

Download SoftwareProduct DocumentationSecurity Hub

Education

Tutorial VideosSolution GalleryEducation courses

Community

GuidelinesGrandmastersEvents
x_social-icon_white.svglinkedin_social-icon_white.svg
Strategy logoCommunity

© Strategy Inc. All Rights Reserved.

LegalTerms of UsePrivacy Policy
  1. Home
  2. Topics

KB246346: How to change the color of the specific category in a bar graph according to the user who logged in MicroStrategy 9.x?


Community Admin

• Strategy


How to change the color of the specific category in a bar graph according to the user who logged in MicroStrategy 9.x?

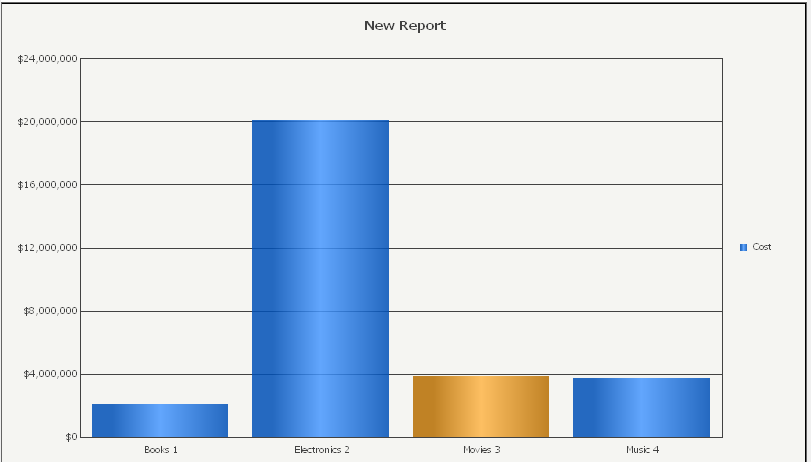
Users may want to highlight the specific category which the logged in user belongs to as shown in the image below:
ka04W000000OgpkQAC_0EM440000002C5R.jpeg

 
The following example shows how to change the color of the specific category in a bar graph according to the user who logged in:
 

  • Create a database table which contains the user name and its attribute id.
  • Create a metric, ‘User_Category’ using ‘User Login’ system prompt and define the expression as follows:
    
    ApplyAgg("(select max(cat_id) from DEMO_LOGIN where username=#0)", ?[User Login]) {~}
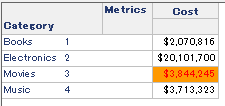
  • Create a report and add the Category attribute and Cost metric on the template, and add the User_Category metric to the report objects.
     
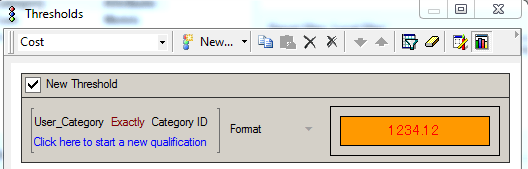
  • Apply a threshold on the Cost metric to compare the User_Category value and Category ID as shown in the image below:
ka04W000000OgpkQAC_0EM440000002C5b.jpeg
  • The threshold color on Cost metric is applied per the user who logged in.
ka04W000000OgpkQAC_0EM440000002C5W.jpeg

Comment

0 comments

Details

Knowledge Article

Published:

June 8, 2017

Last Updated:

June 8, 2017