Overview
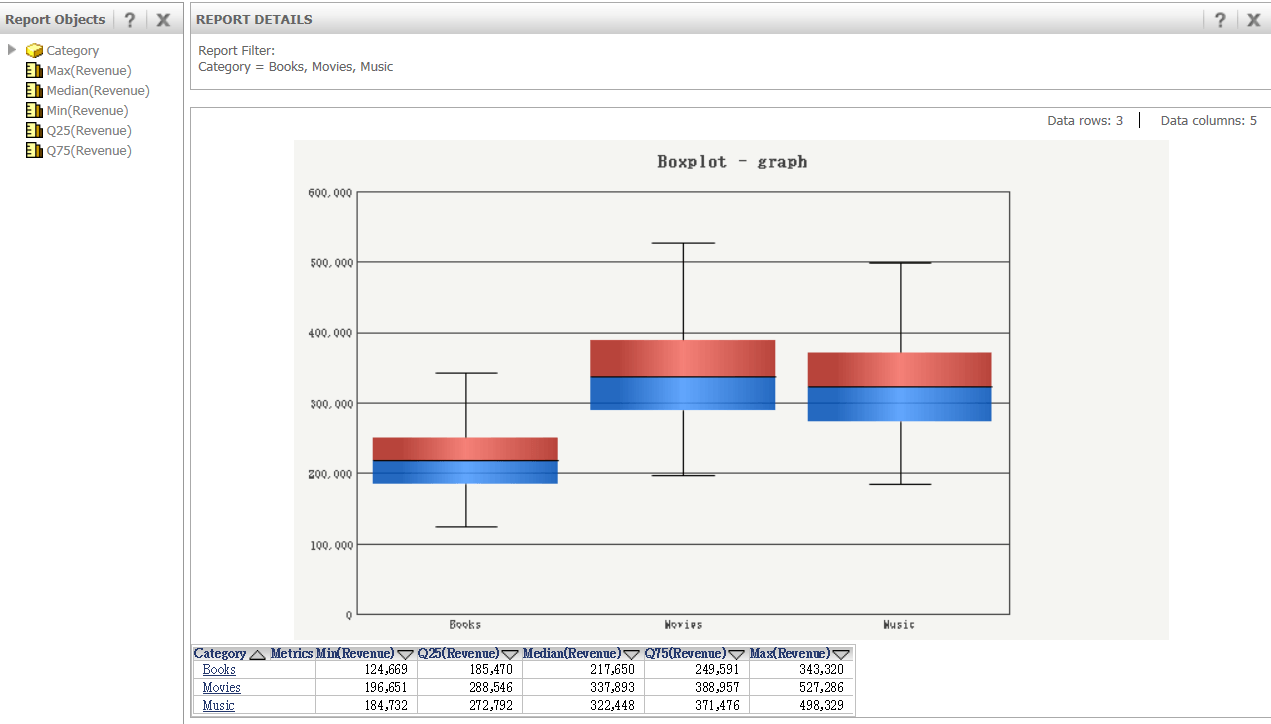
A Boxplot (sometimes called a box and whisker plot) is a graph type designed to compare similar distributions at a glance. The goal of Boxplot graphs is to make the center, spread, and overall range of values immediately apparent. The Boxplot is useful for isolating the extreme values and identifying the range of middle values in your data. The box shows the median values of a variable, while the whiskers stretch to the greatest and lowest values of that variable. Boxplots can also help you identify symmetrical or skewed distributions among values. This technical note describes the details steps to implement the Boxplot in Strategy.
Requirements
Five metrics holding the following values must appear on the report template in the following order:
Object Design
Each metric could be defined as follows, and the metric level needs to be defined if necessary.
Demonstration
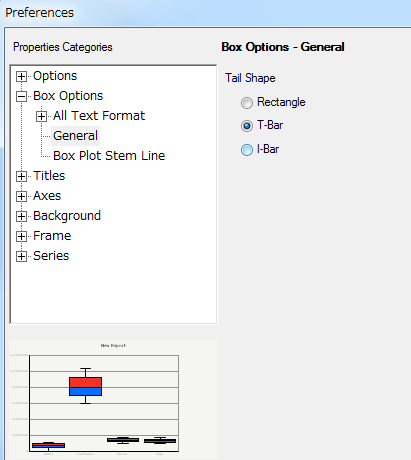
The screenshots below display the definition for the first quartile, a Boxplot against the Category attribute, and the preference.