EducationSoftwareStrategy.com
StrategyCommunity

Knowledge Base

Product

Community

Knowledge Base

TopicsBrowse ArticlesDeveloper Zone

Product

Download SoftwareProduct DocumentationSecurity Hub

Education

Tutorial VideosSolution GalleryEducation courses

Community

GuidelinesGrandmastersEvents
x_social-icon_white.svglinkedin_social-icon_white.svg
Strategy logoCommunity

© Strategy Inc. All Rights Reserved.

LegalTerms of UsePrivacy Policy
  1. Home
  2. Topics

KB267668: How to show a Scatter Plot using C3.js library in Visual Insight Dashboard in MicroStrategy Web?


Community Admin

• Strategy


how to show a Scatter Plot using C3.js library in Visual Insight Dashboard in MicroStrategy Web using Web SDK.

C3 is a wrapper library of D3 and makes it easier to generate D3-based charts.
The following sample code demonstrates how to show a Scatter Plot using C3.js library in Visual Insight Dashboard in Strategy Web 10.x. The code is written based off of the sample code at http://c3js.org/samples/chart_scatter.html.

ka04W00000148qLQAQ_0EM440000002GON.jpeg

 
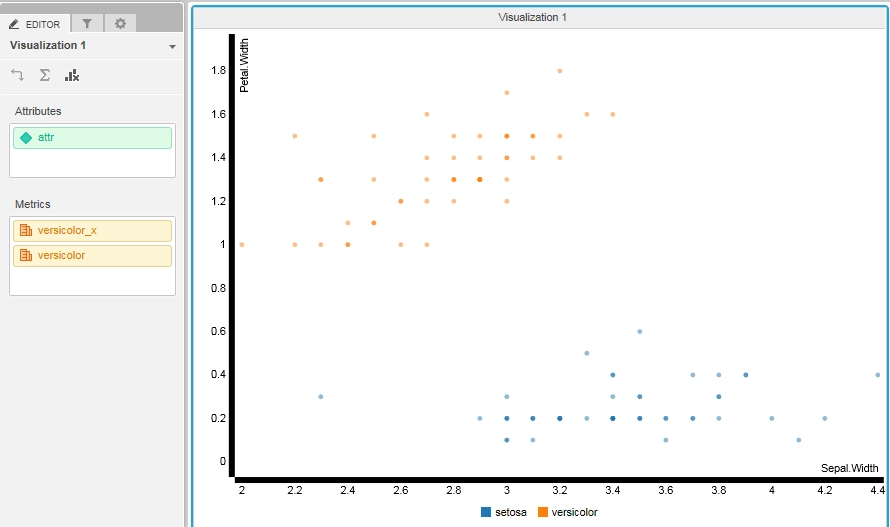
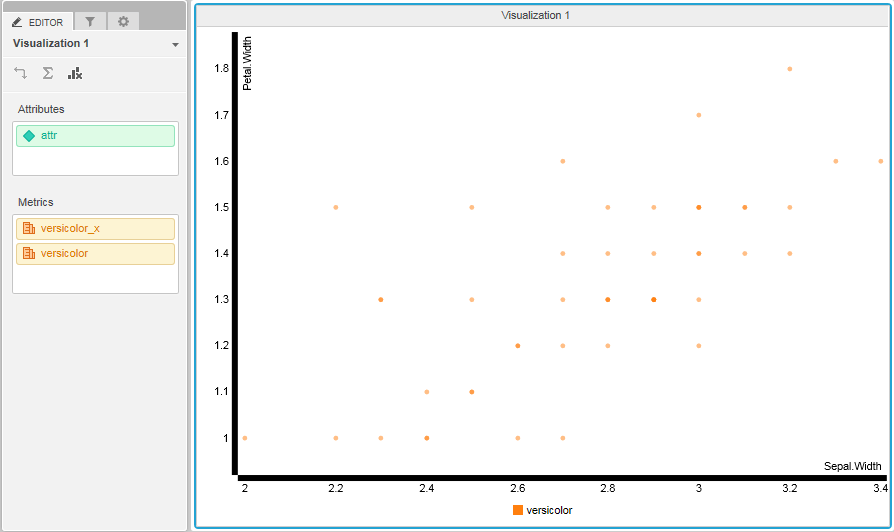
Unloading the preset data of ‘setosa’ after 2 seconds, the chart redraw the grid data of ‘versicolor’ as shown in the image below:

ka04W00000148qLQAQ_0EM440000002GOO.jpeg

 
The code of this visualization:


/**
 * Import C3 visualization at http://c3js.org/samples/chart_scatter.html
 */
(function () {
    // Define this code as a plugin in the mstrmojo object
    if (!mstrmojo.plugins.C3chart_scatter) {
        mstrmojo.plugins.C3chart_scatter = {};
    }
    // All mojo visualization require the CustomVisBase library to render
    mstrmojo.requiresCls("mstrmojo.CustomVisBase",
                         "mstrmojo.models.template.DataInterface"
                        );
    // Declare the visualization object
    mstrmojo.plugins.C3chart_scatter.C3chart_scatter = mstrmojo.declare(
        // Declare that this code extends CustomVisBase
        mstrmojo.CustomVisBase,
        null,
        {
            // Define the JavaScript class that renders your visualization as mstrmojo.plugins.{plugin name}.{js file name}
            scriptClass: 'mstrmojo.plugins.C3chart_scatter.C3chart_scatter',
            externalLibraries: [{url: "http://d3js.org/d3.v3.min.js"},{url: "https://cdnjs.cloudflare.com/ajax/libs/c3/0.4.10/c3.min.js"}],
            plot: function () {
 	            console.log("C3chart_scatter:starting...");
                
                var domNode = this.domNode;
                
                // data from dataset
                var gridData = new mstrmojo.models.template.DataInterface(this.model.data);
                var metric_1 = gridData.getColHeaders(0).getHeader(0).getName(); 
                var metric_2 = gridData.getColHeaders(0).getHeader(1).getName(); 
                var arrayX = [metric_1];
                var arrayY = [metric_2];
                var n = gridData.getTotalRows();
                
                for(i=1; i <= n; i++){
                    arrayX[i] = gridData.getMetricValue(i-1,0).getValue();
                }

                for(i=1; i <= n; i++){
                    arrayY[i] = gridData.getMetricValue(i-1,1).getValue();
                }
                
                var chart = c3.generate({
                    bindto: domNode,
                    data: {
                        xs: {
                            'setosa': 'setosa_x',
                            //TODO
                            versicolor : metric_1,
                        },
                        // iris data from R
                        columns: [
                            ["setosa_x", 3.5, 3.0, 3.2, 3.1, 3.6, 3.9, 3.4, 3.4, 2.9, 3.1, 3.7, 3.4, 3.0, 3.0, 4.0, 4.4, 3.9, 3.5, 3.8, 3.8, 3.4, 3.7, 3.6, 3.3, 3.4, 3.0, 3.4, 3.5, 3.4, 3.2, 3.1, 3.4, 4.1, 4.2, 3.1, 3.2, 3.5, 3.6, 3.0, 3.4, 3.5, 2.3, 3.2, 3.5, 3.8, 3.0, 3.8, 3.2, 3.7, 3.3],
                            arrayX,
                            ["setosa", 0.2, 0.2, 0.2, 0.2, 0.2, 0.4, 0.3, 0.2, 0.2, 0.1, 0.2, 0.2, 0.1, 0.1, 0.2, 0.4, 0.4, 0.3, 0.3, 0.3, 0.2, 0.4, 0.2, 0.5, 0.2, 0.2, 0.4, 0.2, 0.2, 0.2, 0.2, 0.4, 0.1, 0.2, 0.2, 0.2, 0.2, 0.1, 0.2, 0.2, 0.3, 0.3, 0.2, 0.6, 0.4, 0.3, 0.2, 0.2, 0.2, 0.2],
                            arrayY,
                        ],
                        type: 'scatter'
                    },
                    axis: {
                        x: {
                            label: 'Sepal.Width',
                            tick: {
                                fit: false
                            }
                        },
                        y: {
                            label: 'Petal.Width'
                        }
                    }
                });


                setTimeout(function () {
                    chart.unload({
                        ids: 'setosa'
                    });
                }, 2000);


            }
        });
})();

 
ADDITIONAL INFORMATION:
 
The Strategy SDK allows you to customize the standard Strategy Web interface, and extend and integrate the Strategy business intelligence functionality into other applications. However, before changing the way Strategy Web products look or behave, it is helpful to understand how the application is built. For more information regarding the Strategy Web architecture or the process of customizing Strategy Web, please refer to Strategy Developer Zone (https://community.strategy.com/topic/0TO44000000FliLGAS/sdk).
 
To access the Strategy Developer Zone, you must have access to the Strategy Knowledge Base, you must have purchased the Strategy SDK, and you must be current on your Strategy maintenance agreement. If you are a US-based business and believe that you satisfy all three of these conditions but you do not have access to the Strategy Developer Zone, please contact Strategy Technical Support at support@microstrategy.com or at (703) 848-8700 . If you are an international business, please contact Strategy Technical Support at the appropriate email address or phone number found at https://www.microstrategy.com/en/support/contact-support.
 
 
CUSTOMIZATION WARNING:
 
This customization is provided as a convenience to Strategy users and is only directly applicable to the version stated. While this code may apply to other releases directly, Strategy Technical Support makes no guarantees that the code provided will apply to any future or previous builds. In the event of a code change in future builds, Strategy Technical Support makes no guarantee that an updated version of this particular customization will be provided. In the event of a code change in future builds, Strategy may not be able to provide additional code on this matter even though this customization is provided at this time for this specific build. For enhancements to this customization or to incorporate similar functionality into other versions, contact your Account Executive to inquire about Strategy Consulting assistance.


Comment

0 comments

Details

Knowledge Article

Published:

June 12, 2017

Last Updated:

June 12, 2017