EducationSoftwareStrategy.com
StrategyCommunity

Knowledge Base

Product

Community

Knowledge Base

TopicsBrowse ArticlesDeveloper Zone

Product

Download SoftwareProduct DocumentationSecurity Hub

Education

Tutorial VideosSolution GalleryEducation courses

Community

GuidelinesGrandmastersEvents
x_social-icon_white.svglinkedin_social-icon_white.svg
Strategy logoCommunity

© Strategy Inc. All Rights Reserved.

LegalTerms of UsePrivacy Policy
  1. Home
  2. Topics

KB272707: Using an ESRI map visualization as a filter in a Visual Insight dashboard filters with only the last row of the tooltip data in MicroStrategy Web 10.


Community Admin

• Strategy


In MicroStrategy Web 10, users can use an ESRI Map as a filter for other visualizations. When the ESRI map contains an attribute in the tooltip drop zone different than the GEO attribute, hovering over the markers will display a table of data that represents the relationship between those two attributes in the tooltip. When clicking on the marker to activate the filter, the target visualizations get filtered by only the last element in the tooltip table

SYMPTOM:
In Strategy Web 10, users can use an ESRI Map as a filter for other visualizations. When the ESRI map contains an attribute in the tooltip drop zone different than the GEO attribute, hovering over the markers will display a table of data that represents the relationship between those two attributes in the tooltip. When clicking on the marker to activate the filter, the target visualizations get filtered by only the last element in the tooltip table, as shown below.
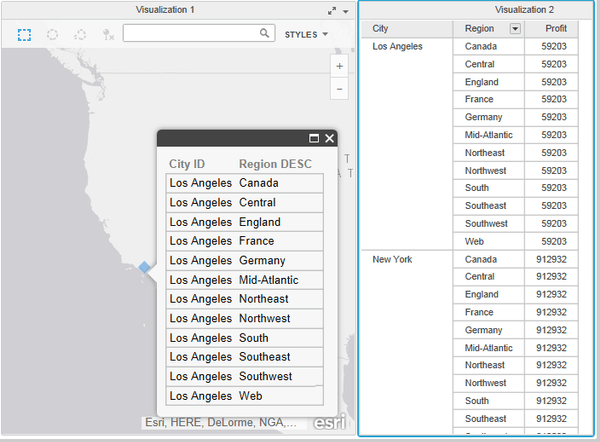
Before filtering:
ka04W000000OaS6QAK_0EM4400000025Vm.jpeg

Notice how all Regions exist for every City, thus clicking on the Los Angeles city marker should result in seeing only Los Angeles, but all Regions.
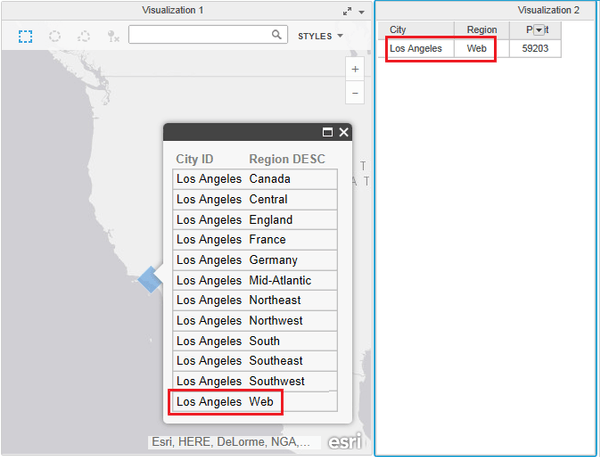
After filtering:
ka04W000000OaS6QAK_0EM4400000025Vw.jpeg

Notice that the target visualization displays only Los Angeles and only the last Region: Web. There is no way to make the ESRI marker filter for any other region, since hovering away from the marker makes the tooltip disappear.
STEPS TO REPRODUCE:

  1. Create a Visual Insight dashboard. 
  2. Use a dataset that has a GEO attribute and a metric to create an ESRI map visualization.
  3. Add another attribute to the tooltip drop zone.
  4. Add a second visualization with the GEO attribute and the attribute placed in the tooltip drop zone.
  5. Hover over the ESRI map visualization and click on the pop up menu on the top right corner.
  6. Select 'Use as Filter'.
  7. Target the second visualization. 
  8. Hover the mouse over one of the markers, but don't click on it.
  9. Notice the tooltip appears with the table showing the relationship between the two attributes.
  10. Click on the marker.
  11. Notice the target visualization is filtered by the last row.

CAUSE:
This is an identified defect in Strategy Web 10. 
ACTION:
This issue has been addressed in Strategy Web 10.4. Upgrade to this version to take advantage of this fix.
The Strategy Internal Reference Number for the issue discussed in this technical note is DE23124. 
KB272707


Comment

0 comments

Details

Knowledge Article

Published:

April 26, 2017

Last Updated:

November 28, 2018