SYMPTOM:
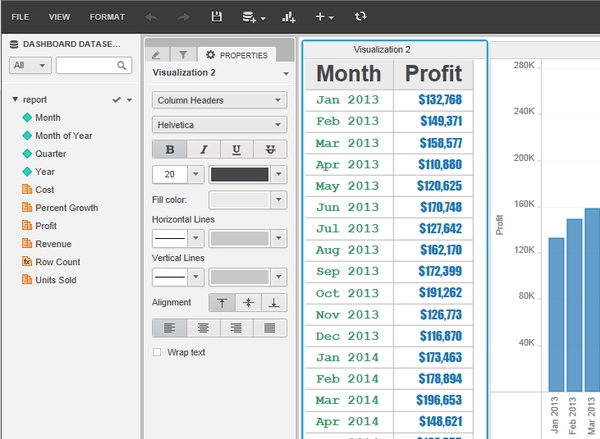
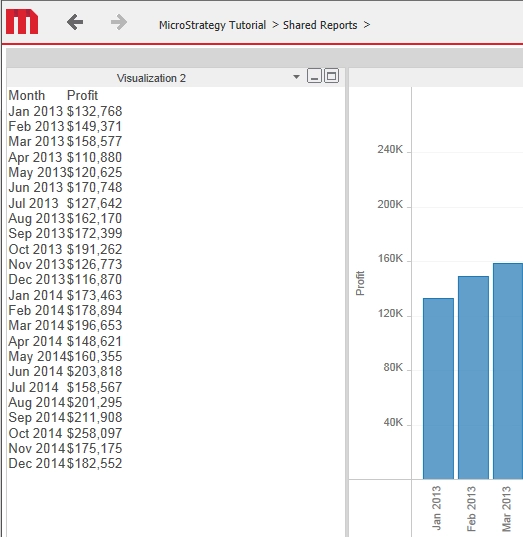
In Strategy Web 10.1, users can create Visual Insight dashboards and then convert them over into Report Services documents. When converting a dashboard that contains a grid visualization and a bar graph, into a document, the grid will lose its formatting, in Presentation mode, as shown below.
In Visual Insight:
In Presentation mode:
STEPS TO REPRODUCE:
CAUSE:
This is an identified defect in Strategy Web 10.0.
ACTION:
This issue has been addressed in Strategy Web 10.2. Upgrade to this version to take advantage of this fix.
WORKAROUND:
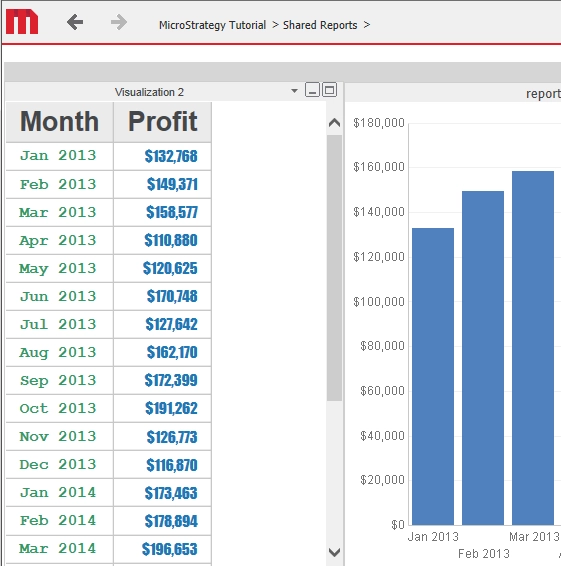
Deleting the graph, in the RS Document, will result in the grid keeping its original formatting. The graph will have to be recreated in the document, and the issue will not occur, as shown below:
The Strategy Internal Reference Number for the issue discussed in this technical note is DE20678.
