EducationSoftwareStrategy.com
StrategyCommunity

Knowledge Base

Product

Community

Knowledge Base

TopicsBrowse ArticlesDeveloper Zone

Product

Download SoftwareProduct DocumentationSecurity Hub

Education

Tutorial VideosSolution GalleryEducation courses

Community

GuidelinesGrandmastersEvents
x_social-icon_white.svglinkedin_social-icon_white.svg
Strategy logoCommunity

© Strategy Inc. All Rights Reserved.

LegalTerms of UsePrivacy Policy
  1. Home
  2. Topics

KB286281: Using the quick switch to display a graph will only show the default number of series and categories in MicroStrategy Mobile 10.2


Community Admin

• Strategy


This document discusses a known issue with MicroStrategy Mobile 10.2 that using the quick switch to display a graph will only show the default number of series and categories.

SYMPTOM:
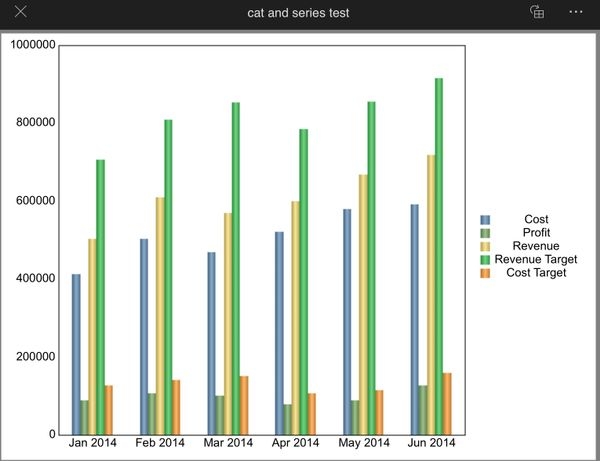
Graph reports can be composed of an attribute that has more than 6 elements and over 5 metrics. In Strategy Web 10.2, the number of categories and series can be increased to display all of the elements and metrics. However, when the same report is run in Strategy Mobile 10.2 as grid view first, and the user uses the quick switch button to change to graph view, the graph will only show the default amount of categories and series, 6 and 5, respecitvely.
Strategy Web 10.2 Graph View:

ka04W000000OhYoQAK_0EM4400000029oD.jpeg

Strategy Mobile 10.2 Graph View after using the quick switch:
ka04W000000OhYoQAK_0EM4400000029oI.jpeg

 
STEPS TO REPRODUCE:

  • Create a report in Strategy Web 10.2 with an attribute that has at least seven elements and at least six metrics.
  • Run the report in Graph view.
  • Click Format > Graph.
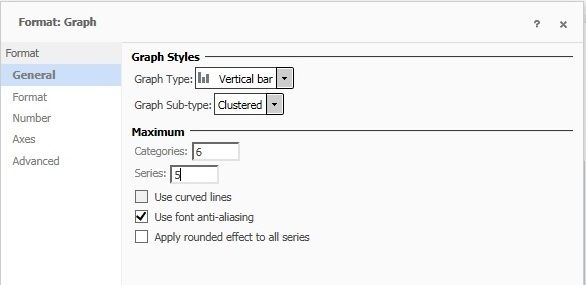
  • Change 'Categories' to be greater than the default of 6 and change 'Series' to be greater than the default of 5 , as shown below.
    Default values:
ka04W000000OhYoQAK_0EM4400000029oF.jpeg
  • New Values:
ka04W000000OhYoQAK_0EM4400000029oO.jpeg
  • Switch back to grid view and save the report.
  • Run the report in the Strategy Mobile 10.2 app. 
  • Use the quick switch button to switch the view to graph view, as shown below:

ka04W000000OhYoQAK_0EM4400000029oJ.jpeg
  • Notice that the graph only shows 6 series and 5 categories - the default values.

 
CAUSE:
This is an identified defect in Strategy Mobile 10.2.
 
ACTION:
Currently this issue is still being reviewed for feasibility by our Technology team and it is not scoped for any upcoming scheduled Strategy release.
 
WORKAROUND:
While in Strategy Web 10.2, switch to graph view and save the report. Now, when run in Strategy Mobile 10.2 the graph appears with the specified number of categories and series.

ka04W000000OhYoQAK_0EM4400000029oL.jpeg

 
The Strategy Internal Reference Number for the issue discussed in this technical note is DE28302.


Comment

0 comments

Details

Knowledge Article

Published:

May 15, 2017

Last Updated:

May 15, 2017