SYMPTOM:
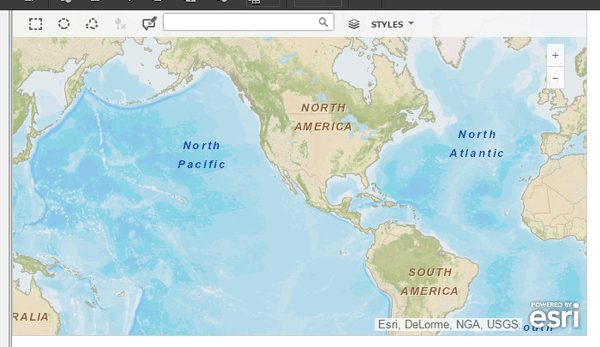
In previous versions of Strategy Web, ESRI maps could be rendered in Interactive mode. Starting in Strategy Web 10.2, metrics set to display as markers are not plotted on ESRI maps. Only a zoomed out ESRI map with no markers appears, as seen below.
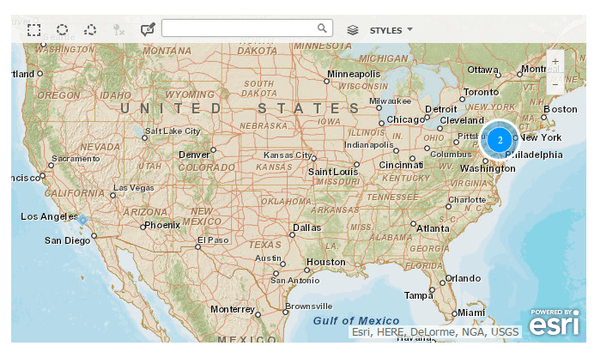
The metrics are correctly plotted in Presentation mode, as seen below.
Note that this issue occurs for documents upgraded to Strategy Web 10.2 as well as for new documents created in Strategy Web 10.2.
STEPS TO REPRODUCE:
Certified | Certified | Certified | Certified |
Certified | Certified | Certified | Certified |
Certified | Certified | Certified | Certified |
Certified | Certified | Certified | Certified |

CAUSE:
This is working as designed in Strategy Web 10.2. Interactive mode was deprecated in Strategy Web 10.1 as outlined in tech note KB257502.
ACTION:
Run the document in Presentation to see the markers correctly plotted on the ESRI map.
KB287892