SYMPTOM:
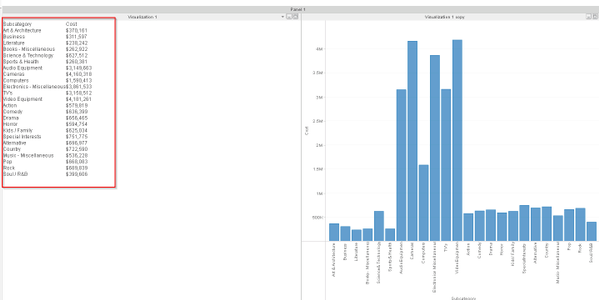
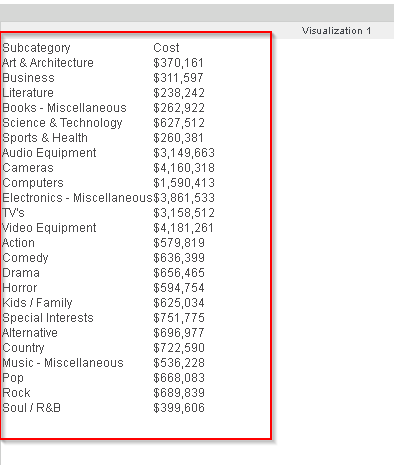
When a VI Dashboard with at least two different visualizations is converted to Document, grid visualization loses its formatting.
STEPS TO REPRODUCE:
Following steps will lead to the described situation:
1. Create VI Dasboard with at least two different visualizations
2. One of the visualizations has to be a grid
4. Convert Document
5. Run in Presentation Mode
The result is as shown below:
CAUSE:
This is a known issue in Strategy Web 10.1
ACTION:
This issue has been addressed in Strategy Web 10.2. Upgrade to take advantage of the fix.
WORKAROUND:
1. Instead of graph use a grid visualization, then save the VI dashboard.
2. Convert to a Document.
3. Change chosen grid to graph.
4. Run the document in Presentation Mode.
