In Strategy Web prior to 10.3, it is only possible to show the number of data points in a cluster in ESRI map, but not able to show the portion of each data point, as shown below:

In Strategy Web 10.3, a new feature is introduced to cluster data points in ESRI map as pie style.
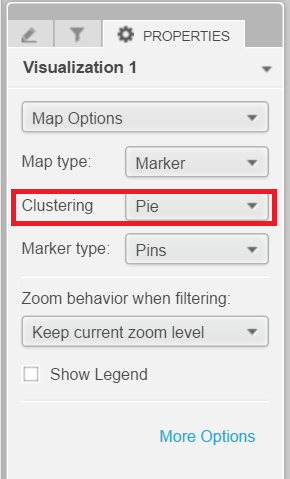
When cluster option is set to pie as below:
A new option "Angle" is shown in Editor pane, as shown below:
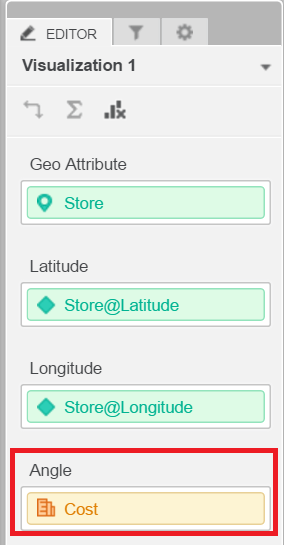
Define a metric in Angle, the cluster markers will show a pie chart according to metric value, as shown below:

KB291772
