SUMMARY:
Hierarchy Reporting is a new feature introduced in Strategy 10.4 Secure Enterprise Platform. This technical note explains the supported configurations, required changes in Strategy Web preferences, a Hierarchical Attribute and its creation steps, and general features of Hierarchy Reporting.
WHAT IS HIERARCHY REPORTING?
Unbalanced hierarchies(also known as ragged hierarchies) are hierarchies with branches that descend to inconsistent levels. For example, in an Employee hierarchy, different parts of the organizational structure will have more management levels than others.
Many organizations have aspects of their business that are organized in unbalanced hierarchies. Besides the Employee hierarchy, other typical examples include a chart of accounts, complex product portfolios, and multinational geographic groupings.
Hierarchy Reports are a class of reports in which the data is naturally organized and presented in a hierarchical structure. Hierarchy Reporting features treat hierarchies as a first-class citizen, and make interacting with entire hierarchies intuitive and efficient. Both balanced and unbalanced hierarchies may be represented in a hierarchy report, although unbalanced hierarchies benefit the most from Hierarchy Reporting features.
SUPPORTED DATA SOURCE AND INTERFACES
In Strategy 10.4 Secure Enterprise Platform, the following data sources are supported for Hierarchy Reporting. See the Readme for the exact database versions supported.
Hierarchy Reporting features are currently supported only in Dashboard (Visual Insight). Normal reports, Report Services documents, and Mobile are not supported in version 10.4.
WEB PREFERENCE
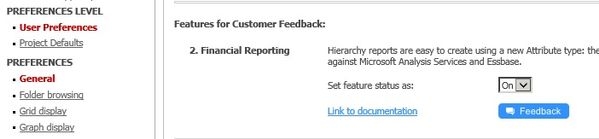
Hierarchy Reporting is released as a Preview feature in Strategy 10.4 Secure Enterprise Platform. When Strategy is installed, Hierarchy Reporting will be disabled by default. To enable Hierarchy Reporting, implement the following steps:
HIERARCHICAL ATTRIBUTE
In order to facilitate the building of hierarchy reports, 1Strategy Secure Enterprise Platform 10.4 introduces a new type of attribute: the hierarchical attribute. The hierarchical attribute represents an entire hierarchy and all its levels. For example, you may have a Time hierarchical attribute that represents the Time hierarchy, including its levels Year, Quarter, Month, and Day. In contrast, a normal attribute usually represents a single level of a hierarchy (e.g., Year). The hierarchical attribute can be placed on a grid, filtered, and sorted, much like a normal attribute.
CREATING HIERARCHICAL ATTRIBUTES WITH DATA IMPORT
To create a hierarchy report, the first step is to perform a Data Import and connect to an OLAP data source. There are two ways to initiate the Data Import:
1) Create a standalone Intelligent Cube
The Intelligent Cube can be used to create dashboards at a later time. To import data into an Intelligent Cube, click on the Create button in the upper left of any page, and select Add External Data.
2) In Visual Insight Dashboard, import data
Data can be imported from within a dashboard. Create a new dashboard by clicking on the Create button in the upper left of any page, and select New Dashboard. In the dashboard toolbar, click the arrow next to the Add Dataset icon

, then select External Data.
Once Data Import is initiated, take the following steps to create hierarchical attributes:
Using Hierarchical Attributes in a Visual Insight Dashboard
When a Visual Insight dashboard is linked to a dataset, the hierarchical attributes are listed in the Datasets Panel. Hierarchical attributes will be denoted with the

icon. To use a hierarchical attribute in a visualization, simply drag-and-drop the desired hierarchical attribute into the main panel.
To search for the desired hierarchical attribute, use the Search box at the top of the Datasets Panel.
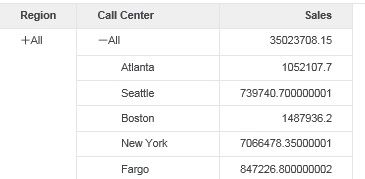
When the hierarchical attribute is first placed on a grid, the hierarchy will be displayed with its element tree collapsed. Elements can be expanded and collapsed by clicking on the + (expand) or – (collapse) button next to the element.
NAVIGATION SHORTCUTS
Every level of the entire hierarchy can be expanded or collapsed by using the Expand/Collapse All Levels shortcut.
A similar shortcut is available for each element as well, in order to expand every level of a branch.
SORTING
When a report with a hierarchical attribute is sorted, the structure of the hierarchy will remain intact, so every element will retain its parent in the hierarchy tree. Each level of the hierarchy will be sorted separately from the other levels.
To sort on a hierarchy or a metric, hover over the row or column header to reveal an arrow on the right side of the header. Click on the arrow. The sorting options available are:
The Advanced Sort dialog will allow users to:
FILTERING
To filter the data in a dashboard sheet, drag a hierarchical attribute into the Filter Panel. The Filter Panel will display the elements of the hierarchy in a tree. Select or deselect elements to filter the data.
FILTER SELECTION SHORTCUTS
Groups of elements can be selected or deselected with the use of shortcut buttons. There are two types of shortcuts: branch selection, and level selection.
Users may want to see all elements of a hierarchy branch. For example, if users want to see the Year 2015 along with all Quarters and Months of 2015. To select or deselect all elements of a branch in the Filter Panel, hover over an element to reveal the branch selection shortcut

to the right of the element. Click on the branch selection shortcut.
Users may also want to see only the elements of a particular level of the hierarchy. For example, a user may want to see data at the Year level for every Year, but not data at the Quarter or Month levels. The level selection shortcut is a row of buttons above the hierarchy.

To select or deselect all elements of a level, click on the button corresponding to the hierarchy level. Clicking on the All button will select or deselect all elements.
APPLYING MULTIPLE FILTER CHANGES ALL AT ONCE
By default, each time a change to the filter is made, the data in the sheet will be immediately refreshed. If the sheet contains large amounts of data, it may be helpful to apply a number of filter changes all at once. In order to be able to make a number of changes to the filter before applying it, click on the arrow at the top right of the Filter Panel, and de-select the Auto-apply Filters option. An Apply button will appear at the top of the Filter Panel.
For more information on the Visual Insight Dashboard Filter Panel, see Creating filters for a sheet of data.
VISUAL INSIGHT DASHBOARD FEATURES NOT SUPPORTED BY HIERARCHY REPORTING IN Strategy Secure Enterprise Platform 10.4
The hierarchical attribute is not supported by some features in Visual Insight Dashboard. When a hierarchical attribute is in the dashboard’s dataset, the unsupported features will be disabled in the interface.
The following features are not supported by the hierarchical attribute. (For each feature, the location of the feature in the interface is listed. When there are multiple ways to perform the action, only one of the ways is documented below.)
