The Strategy Intelligence Server offers in-memory Intelligent Cubes. The results of the Intelligent Cube reports can be used by multiple users and reports to avoid executing against the data warehouse. Users may find additional information related to managing and using Intelligent Cubes in the System Administration Guide: Chapter 6: "Managing Intelligent Cubes".
Administrative users may be interested in measuring different usage and publication metrics related to Intelligent Cubes. In this technical note we attempt to explain how users can measure the performance of two important cube publication metrics:
Individual processing components within the Intelligence Server contribute in different ways to the overall values of these metrics. The following image shows the Intelligence Server memory usage during a sample cube publication (using the Intelligence Server Normalization method). The diagram plots the cube publication time against the memory usage (in this case resident set size - RSS) of the MSTRSvr process on a Linux operating system.
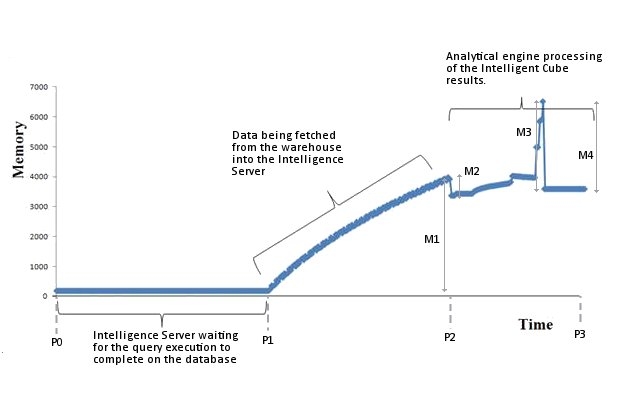
With these individual measurements, users can measure the Intelligent Cube publication performance as:
Intelligent Cube Publication Time: P3 – P0
Intelligent Cube Peak Memory Usage: M1 – M2 + M3
Intelligent Cube Memory Footprint: M1 – M2 + M3 – M4
Each of the cube publication metric parameters (P0, P1, P2, P3, M1, M2, M3 and M4) are important when measuring performance. Care should be taken to interpret and log this data accurately. There are a number of ways to collect information during the Intelligent Cube publication process. The following discussion explains a few methods and details how users may identify the P0, P1, P2, P3, M1, M2, M3 and M4 parameters:
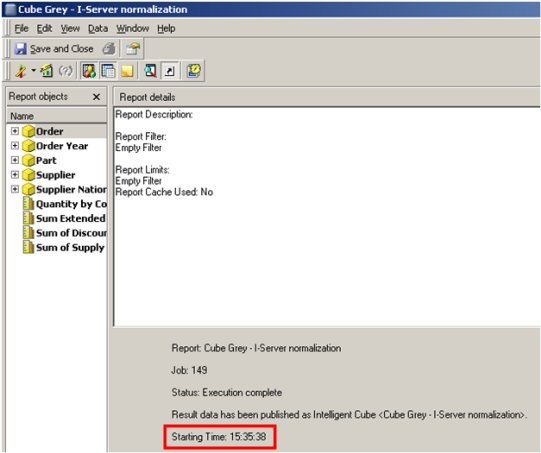
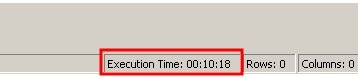
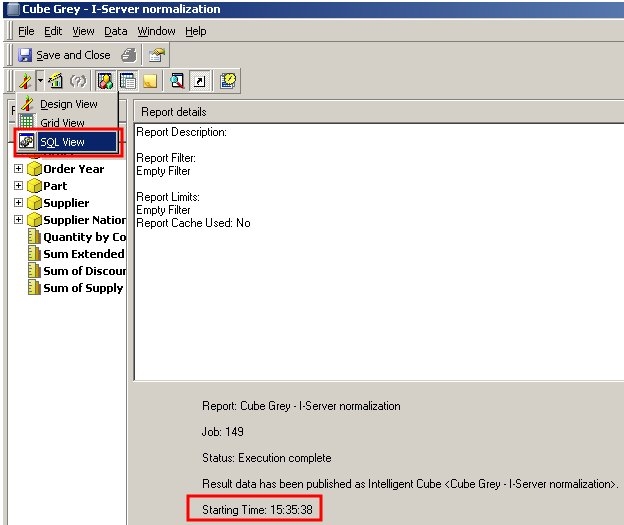
Measuring Intelligent Cube publication times from Strategy Desktop:
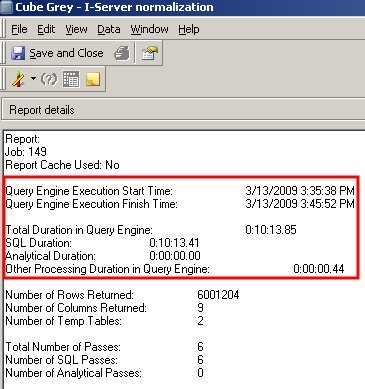
Total Duration in the Query Engine (T4):   10:13.85


SQL Duration (T5):                                         10:13.41

Analytical Duration (T6):                                        0:00

Other Processing Duration in QE (T7):         0:00.44
NATION a16

where pa11.O_ORDERKEY = pa12.O_ORDERKEY and

 pa11.P_PARTKEY = pa12.P_PARTKEY and

 pa11.S_SUPPKEY = pa12.S_SUPPKEY and

 pa11.O_ORDERKEY = a13.O_ORDERKEY and

 pa11.S_SUPPKEY = a14.S_SUPPKEY and

 pa11.P_PARTKEY = a15.P_PARTKEY and

 a14.S_NATIONKEY = a16.N_NATIONKEY


Pass3 -  Duration: 0:00:40.36


Pass4 -  Duration: 0:00:00.07

drop table ZZTKP010045SP000
Using the Performance Monitor Counters to measure Intelligent Cube memory usage and publication times:
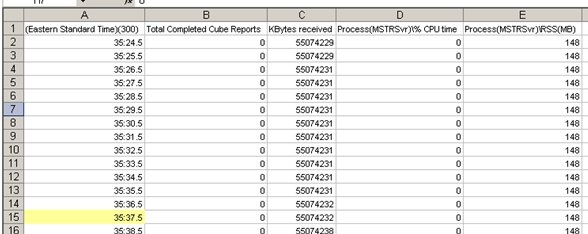
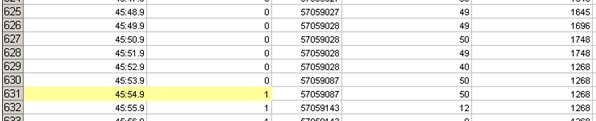
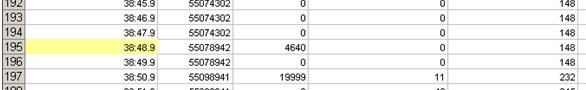
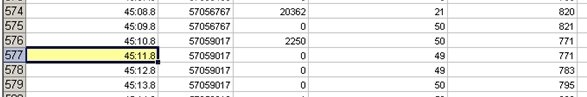
When an Intelligent Cube report is run (published), the Strategy performance counters can be used to gather more information on memory and CPU usage in Intelligence Server. For more information on how to use Diagnostic and Performance Logging tool, users should refer to the System Administration Guide, Section “Configuring what is logged: Diagnostics and Performance Logging tool”. Users should choose a relatively small logging frequency to obtain high resolution of the logged data (at least 1 minute).
The performance counters that should be logged for this process are:
\Process(MSTRSvr)\Size(MB)

\Process(MSTRSvr)\RSS(MB)

\Process(MSTRSvr)\% CPU time

\PhysicalDisk\Total number of bytes written

\PhysicalDisk\Total number of bytes read

\Network Interface\KBytes sent

\Network Interface\KBytes received

\Strategy Server Jobs(CastorServer)\Total Completed Cube Reports