SUMMARY
This document describes how to trace low level engine activity in Strategy 9.x-10.x using the Engine->Perf trace.
DESCRIPTION
The Engine->Perf trace should be enabled from the Strategy Diagnostics Tool and can be used to collect low level information on SQL Engine, Query Engine, and Analytical Engine activity. In certain cases this information can be helpful in troubleshooting performance issues when it is not clear what stage of job execution a bottleneck occurs, or for troubleshooting general errors during job execution when it is not clear at which stage of the job execution an error occurs.
The Perf trace will log information on various steps of job execution that is at a lower level of granularity than what is seen in post-execution SQL view or the Intelligence Server's job step statistics.
For example, the first step of an unprompted ad-hoc report execution from Developer is initializing the report instance. One can see when this step begins and ends by examining the timestamps in the Perf trace:
2016-09-03 19:45:59.005[THR:4672][Engine][Perf] BEGIN: Initializing ReportInstance
2016-09-03 19:45:59.006[THR:4672][Engine][Perf] END: Initializing ReportInstance
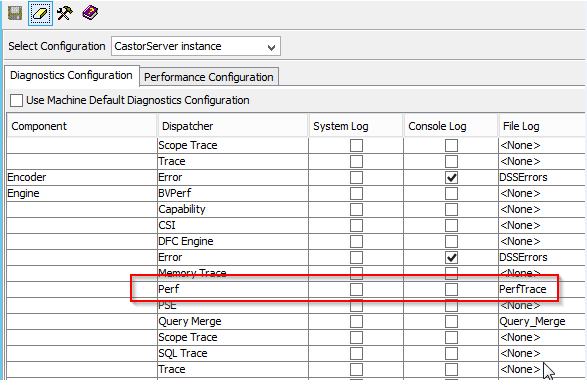
Note: Information regarding when job steps begin and end can also be found in the post-execution SQL view and job step statistics, but at a higher level than what is seen in the Perf trace. When troubleshooting, it is often sufficient to collect these items. The Perf trace should only be enabled when very granular information on job execution is needed, and should not be left on for an extended period of time.
