SYMPTOM:
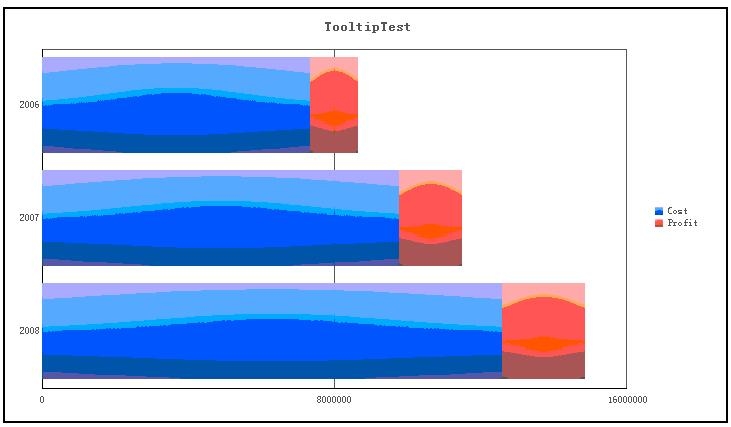
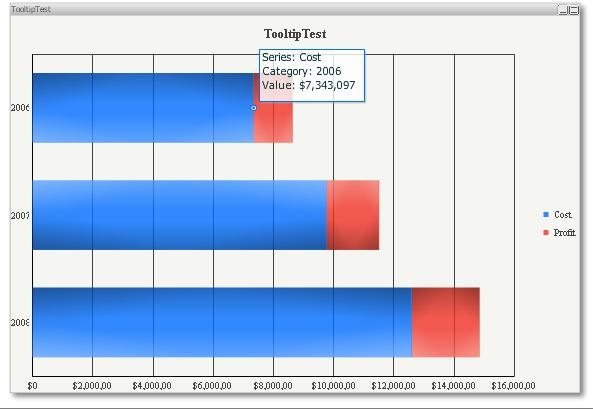
When a stacked bar graph is viewed in a Dashboard, tooltips on the graph display a sum of the metric values that compose the bar, rather than displaying the value of the end metric in Strategy Web.
STEPS TO REPRODUCE:
CAUSE:
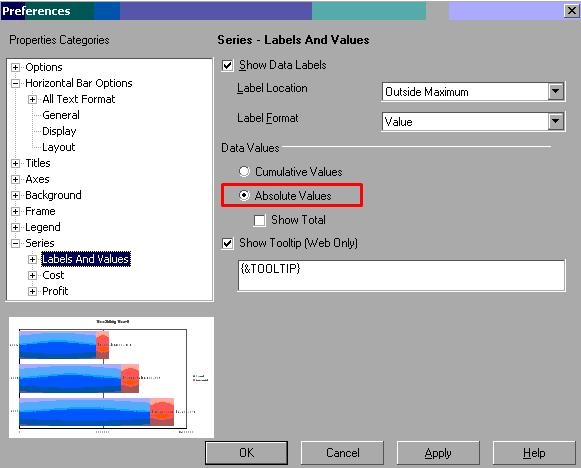
This issue is working as designed. By default, "Cumulative values" is selected at the Preference of Graph Options, which cannot be changed through Web.
ACTION:
Using Developer, execute the dataset as a graph report, then, go to Graph > Graph Options > Series > Labels And Values > "Absolute Values." Change the Data Values option to "Absolute Values":