EducationSoftwareStrategy.com
StrategyCommunity

Knowledge Base

Product

Community

Knowledge Base

TopicsBrowse ArticlesDeveloper Zone

Product

Download SoftwareProduct DocumentationSecurity Hub

Education

Tutorial VideosSolution GalleryEducation courses

Community

GuidelinesGrandmastersEvents
x_social-icon_white.svglinkedin_social-icon_white.svg
Strategy logoCommunity

© Strategy Inc. All Rights Reserved.

LegalTerms of UsePrivacy Policy
  1. Home
  2. Topics

KB31101: How to profile dashboards in Flash Execution Mode in MicroStrategy Web 9.x


Community Admin

• Strategy


How to profile dashboards in Flash Execution Mode in MicroStrategy Web 9.x

Understanding the Flow of Flash Document Execution:
 
Flash document execution is more complex than the executing document in DHTML mode. The entire execution flow is illustrated in the image below:
 

ka04W000000OgfAQAS_0EM4400000028GK.jpeg

 
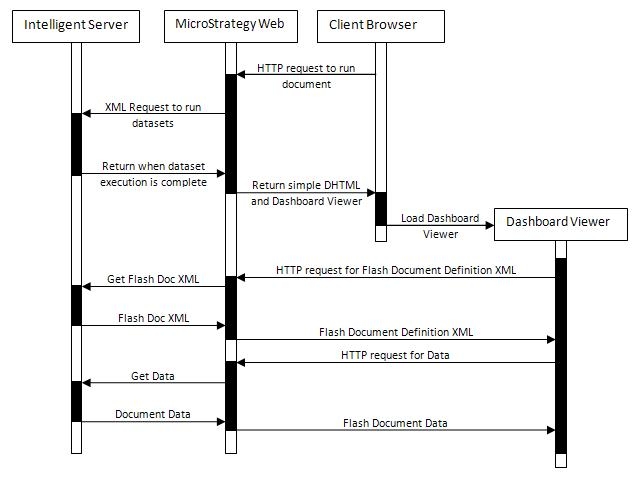
Gathering Data -- Flash Execution Mode:
 
Data gathering in flash execution mode is similar to DHTML, with the exception that there is one more step in the profiling –the flash client execution. To profile flash documents:

  1. Executing the document in Flash mode instead of DHTML mode and gather the data according to Technote: KB31100
  2. Additionally, for each run, gather the flash rendering data using the flash debugger (click on the dashboard, and press the key combination CTRL + ALT + SHIFT + D). In the Error tab, gather the following data (for times, it is the calculation of the difference between the times indicated in the image below):
    1. Size of Definition XML 
    2. Size of Document Data 
    3. Time of Intelligence Server + Network + Parsing of Definition XML of document
    4. Time of Intelligence Server + Network + Parsing of Data of document
    5. Time of document instance creation
    6. Time of pure rendering of document
    7. Time of total flash execution
ka04W000000OgfAQAS_0EM4400000028GA.jpeg


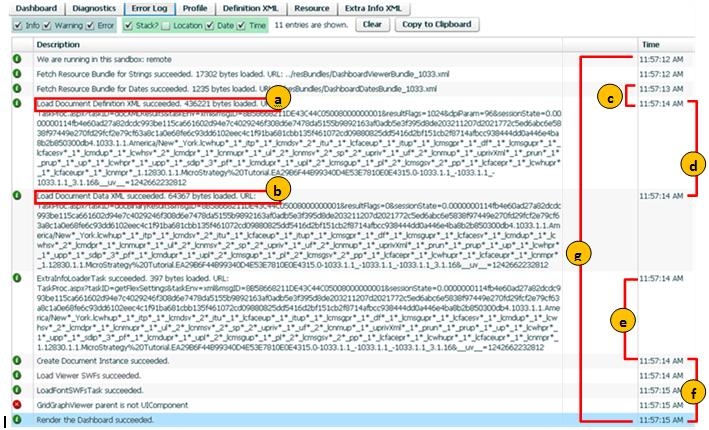
Important notes about the Flash Debugger profiling values:

  • Precision in the flash debugger is seconds, therefore, values can vary as below after calculating the time spent in each step:
    • If value is 0 (no change from step one step to another), real value could be in interval (0, 1).
    •  If value n is > 0, real value could be in interval (n-1, n+1).
  • Load Definition XML time = XML Generation time (of the Intelligence Server) + Network + load time.
  • Load Data XML time = Flex Data Export time (of the Intelligence Server) + Network + load time.


Comment

0 comments

Details

Knowledge Article

Published:

June 13, 2017

Last Updated:

June 13, 2017