SYMPTOM:
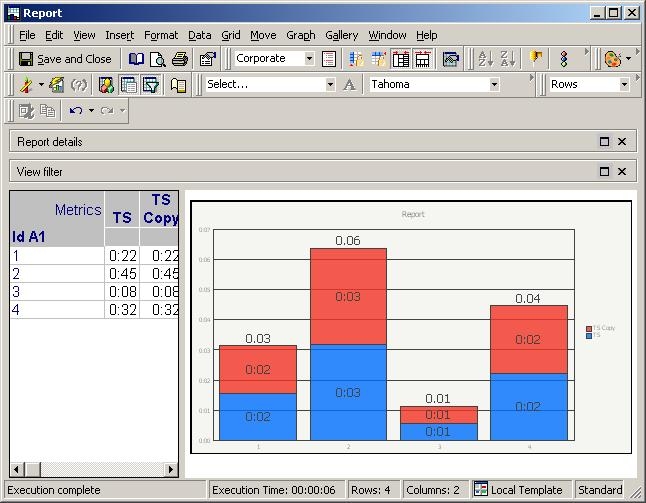
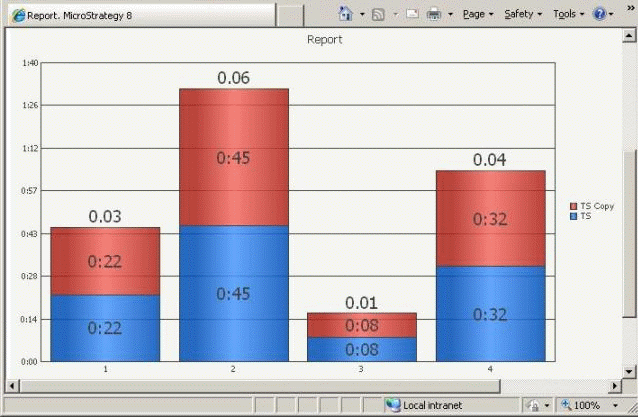
In Strategy Developer 9.x, if a user chooses to display the data label for metrics with custom formatting h:mm, the data labels will not display correctly on Bar Stacked graph; but the number will show up correctly in Strategy Web 9.x. However, if a user enables the option to Show Total for the data labels, the total will not display the correct number in both Developer and Web 9.x.
STEPS TO REPRODUCE:
1. In Strategy Tutorial, add the following table to warehouse
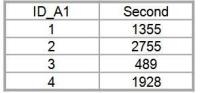
2. Create attribute A1 using ID_A1 as ID form
3. Create fact Second to map to the Second column
4. Create metric Second: Sum(Second) {~}
5. Create metric TS: (Second / ((24 * 60) * 60)). Go to Tools -> Formatting -> Values. Choose Custom, enter expression h:mm
6. Create a copy of metric TS: TS Copy
7. Create a report, put A1 on the row, TS and TS Copy on the column
8. Run report in Grid view, it returns the correct data
9. In Desktop, run report in Grid/Graph view, choose graph type: Vertical Bar Stacked. Go to Graph -> Display -> Data Labels. Then go to Graph -> Graph Options -> Data Labels, choose Absolute Values, enable Show Total.
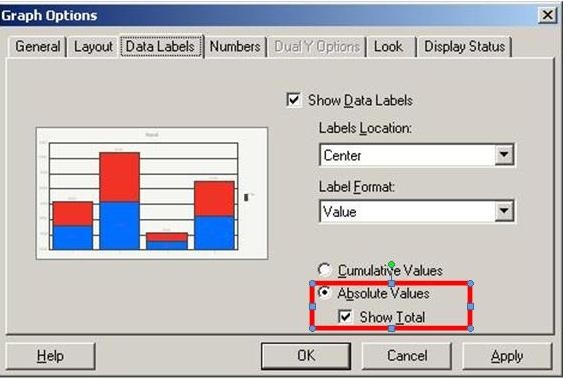
The data label for both metric values and total are incorrect values
10. In Web, run the same report in Graph View. Data label for metric values show up correctly, however the total does not display the correct number
ACTION:
Contact Strategy Technical Support for an update on this issue.
