EducationSoftwareStrategy.com
StrategyCommunity

Knowledge Base

Product

Community

Knowledge Base

TopicsBrowse ArticlesDeveloper Zone

Product

Download SoftwareProduct DocumentationSecurity Hub

Education

Tutorial VideosSolution GalleryEducation courses

Community

GuidelinesGrandmastersEvents
x_social-icon_white.svglinkedin_social-icon_white.svg
Strategy logoCommunity

© Strategy Inc. All Rights Reserved.

LegalTerms of UsePrivacy Policy
  1. Home
  2. Topics

KB318239: Scaling of bar charts in Visual Insight in Microstrategy 10.x removes the biggest bar.


Community Admin

• Strategy


Symptom:
When the visualization with horizontal bar graph size is small, the data value of the biggest bar would not be visible.
 
Steps to reproduce in Tutorial Project:
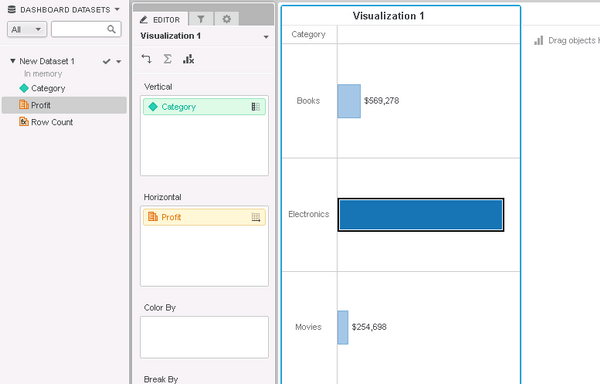
  1. Create a Visual insight Dashboard with Categories and Profit.
  2. Change visualization to horizontal bar graph
  3. Display metric values next to the bar
  4. Change the size of visualization to much smaller - value from Category Electronics is no longer visible as shown below:


ka04W000000OfqmQAC_0EM4400000025MX.jpeg

 
Default setting with 'Hide Overlapping labels ' checked: The value can only be shown when given more space for the visualization.
Uncheck "Hide Overlapping labels ": The value would be truncated at the border so the whole number is not visible as shown below:
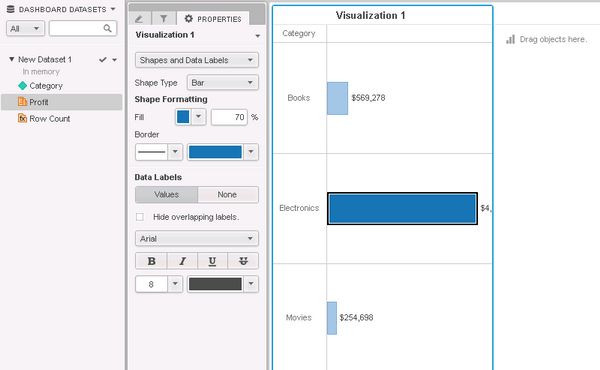
 

ka04W000000OfqmQAC_0EM4400000025MF.jpeg

 
CAUSE:
This is a known issue in Strategy Web 10.x and it is being investigated.
 
ACTION:
Contact MicroStartegy Technical Support for an update on the issue.
 
Workaround:
Based on current design, the workaround is to adjust the scale range to make all the values be shown on graph. (Go to property panel - Data Exploration - Axis scale - Custom, and set the max value to be bigger than maximum value of actual data range) as shown below:
 

ka04W000000OfqmQAC_0EM4400000025ME.jpeg


Comment

0 comments

Details

Knowledge Article

Published:

June 13, 2017

Last Updated:

July 17, 2017