A transformation table is a type of relation table, normally used to create a transformation metric. Refer to the following MicroStrategy Knowledge Base technical note for more information on transformation metrics:
KB7238: Creating transformation, rank and percent to total metrics in MicroStrategy Developer
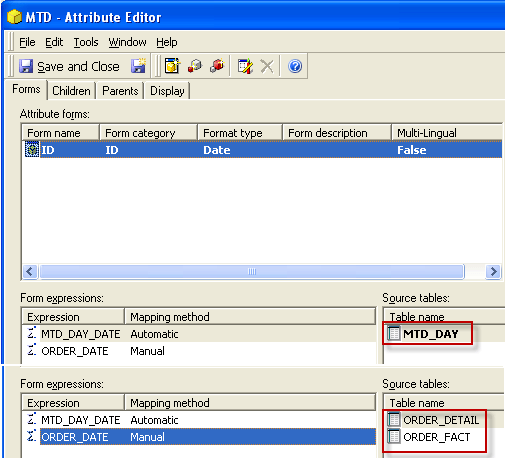
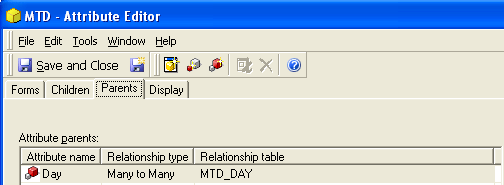
Take the following Month to Day table as an example:
Transformation table 'MTD_DAY':
DAY_DATE | MTD_DAY_DATE |
1/1/2006 | 1/1/2006 |
1/2/2006 | 1/1/2006 |
1/2/2006 | 1/2/2006 |
1/3/2006 | 1/1/2006 |
1/3/2006 | 1/2/2006 |
1/3/2006 | 1/3/2006 |
... | ... |
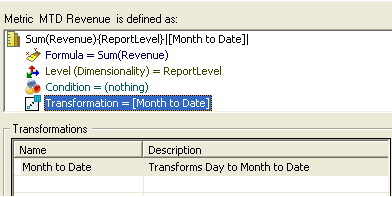
By default the transformation metric with transformation 'Month to Date' will display like this
Day | MTD_metric |
1/1/2006 | 1/1/2006 metric |
1/2/2006 | 1/1/2006 + 1/2/2006 metric |
1/3/2006 | 1/1/2006 + 1/2/2006 + 1/3/2006 metric |
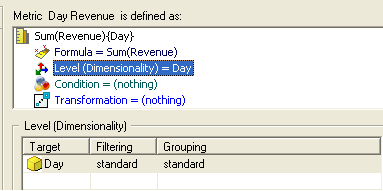
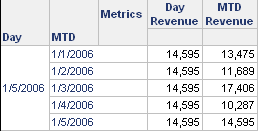
But sometimes, users may want to compare with Day level metric and it's corresponding transformation metric as shown in the following chart:
Day | MTD | Day_metric | MTD_metric |
1/1/2006 | 1/1/2006 | 1/1/2006 metric | 1/1/2006 metric |
1/2/2006 | 1/1/2006 | 1/2/2006 metric | 1/1/2006 metric |
| 1/2/2006 | 1/2/2006 metric | 1/2/2006 metric |
1/3/2006 | 1/1/2006 | 1/3/2006 metric | 1/1/2006 metric |
| 1/2/2006 | 1/3/2006 metric | 1/2/2006 metric |
| 1/3/2006 | 1/3/2006 metric | 1/3/2006 metric |
How to display transformation metric without aggregation:
The following steps may be used as a reference. This example uses the MicroStrategy Tutorial project: