EducationSoftwareStrategy.com
StrategyCommunity

Knowledge Base

Product

Community

Knowledge Base

TopicsBrowse ArticlesDeveloper Zone

Product

Download SoftwareProduct DocumentationSecurity Hub

Education

Tutorial VideosSolution GalleryEducation courses

Community

GuidelinesGrandmastersEvents
x_social-icon_white.svglinkedin_social-icon_white.svg
Strategy logoCommunity

© Strategy Inc. All Rights Reserved.

LegalTerms of UsePrivacy Policy
  1. Home
  2. Topics

KB318533: A “Drill” option can be disabled for all visualizations but not for a Heat Map in Visual Insight in 10.0 - 10.7.


Community Admin

• Strategy


A “Drill” option can be disabled for all visualizations but not for a Heat Map in Visual Insight in 10.0 - 10.7.

SUMMARY:
This issue has been classified as a defect by Strategy. The impact is limited to Strategy Web 10.0 - 10.7 Visual Insight. When drilling is disabled on a report at the project level, the drilling option still appears on a Heat Map visualization. There is no workaround for this issue. The issue has been addressed in a future release.
   
SYMPTOM:
In Strategy Visual Insight, when the drilling gets disabled on a report and project levels, users should not be able to drill from any visualizations; however, users still see the drilling option enabled for Heat Map visualization. The images below demonstrate the issue:
 
Drilling option is displayed for a Heat Map visualization:

ka04W000000OfiuQAC_0EM4400000025QC.jpeg

 
Drilling option is disabled for all other visualizations. To demonstrate the issue, a bar graph was selected as an example:

ka04W000000OfiuQAC_0EM4400000025QL.jpeg

 
STEPS TO REPRODUCE:

  1. In Strategy Tutorial, create a report with Category, Subcategory, Region attributes and several metrics and create a Visual Insight dashboard using the just created report as a dataset.
  2. In the report, under Data menu/Report Data Options, make sure that “Enable report drilling” is not selected:
ka04W000000OfiuQAC_0EM4400000025Q4.jpeg

 
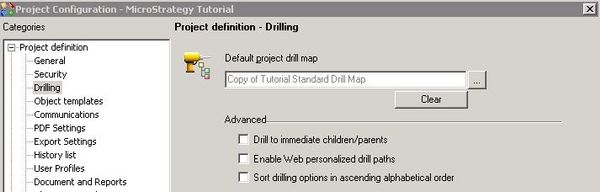
3.  Make a copy of “Tutorial Standard Drill Map” and remove all drilling paths. Apply the empty drill map on a Project level: Project definition/Drilling:

ka04W000000OfiuQAC_0EM4400000025Q7.jpeg


ka04W000000OfiuQAC_0EM4400000025Q3.jpeg


  1. Create a Visual Insight from the just created report and add 2 visualizations:
  • Bar graph visualization (can be any): Region attribute and Revenue metric
  • Heat Map visualization: Category, Subcategory attributes and Cost, Revenue metrics. 
  1. Notice that “Drill” option is greyed out for the Bar graph and available for drilling for Heap Map:


ka04W000000OfiuQAC_0EM4400000025QE.jpeg
ka04W000000OfiuQAC_0EM4400000025QA.jpeg

 
CAUSE:
This is a known issue in Strategy 10.0 - 10.7 that specifically affects Strategy Visual Insight and a Heat Map visualization
 
ACTION
This issue has been fixed in Strategy 10.8, update to this version to take advantage of the fix
KB01187


Comment

0 comments

Details

Knowledge Article

Published:

June 9, 2017

Last Updated:

May 1, 2018