EducationSoftwareStrategy.com
StrategyCommunity

Knowledge Base

Product

Community

Knowledge Base

TopicsBrowse ArticlesDeveloper Zone

Product

Download SoftwareProduct DocumentationSecurity Hub

Education

Tutorial VideosSolution GalleryEducation courses

Community

GuidelinesGrandmastersEvents
x_social-icon_white.svglinkedin_social-icon_white.svg
Strategy logoCommunity

© Strategy Inc. All Rights Reserved.

LegalTerms of UsePrivacy Policy
  1. Home
  2. Topics

KB318718: Tooltips are not displayed in line graphs when running a report services document in Presentation mode in MicroStrategy Web 10.2 and above.


Community Admin

• Strategy


Tooltips are not displayed in line graphs when running a report services document in Presentation mode in MicroStrategy Web 10.2 and above.

SYMPTOM: 
Tooltips are not displayed on line graphs when running a Report Services document in Presentation mode in Strategy Web 10.2 and above.
 
STEPS TO REPRODUCE:
  • In Strategy Web, create a report with the Subcategory Attribute and the Cost metric.
  • Convert the report to a Report Services document.
  • Switch the grid to a Horizontal Line graph, set the height to 1.4 inches and the width to 12 inches.
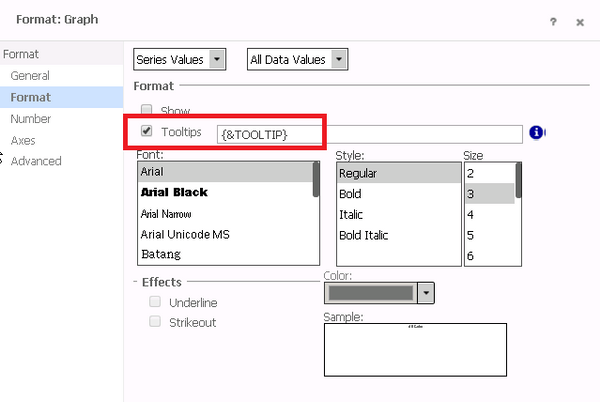
  • Go to Editable mode, right click the Line graph and open "Format" dialog.  Go to "Format" > "Series Value" and check the option "Tooltips", as shown below:
ka04W000000OeKLQA0_0EM4400000025Px.jpeg
  • Go to Presentation mode, place the mouse over the line graph and note that tooltips are not displayed, as shown below:
ka04W000000OeKLQA0_0EM4400000025Pz.jpeg

 
CAUSE: 
This is a graph limitation. When the graph height is less than 1/8 of width it will use 1/8 of width as the graph height to render the graph, and vice versa.  
 
ACTION: 
This issue has been addressed in Strategy Web 10.4 HF3 and 10.7. Upgrade to take advantage of the fix.
 
WORKAROUND:

  • Set the graph width and height to other values to make sure the width is larger than 1/8 of height and height is larger than 1/8 of width.
  • Go to Editable mode, right click the Line graph and open "Format" dialog.  Go to "Format" > "Series markers" and change the size to 40.
  • Go to Presentation mode, place the mouse over the line graph and note that tooltips are displayed correctly, as shown below:
ka04W000000OeKLQA0_0EM4400000025Q1.jpeg

Comment

0 comments

Details

Knowledge Article

Published:

June 12, 2017

Last Updated:

June 12, 2017
