SYMPTOM:
When Filters are added to Strategy Visual Insight Dashboard with multiple visualizations, the filter applies to all the visualizations in a dashboard. Strategy Visual Insight has view filters or visualization-specific filters that can target individual visualization.
DESCRIPTION
A user may want to apply visualization-specific filters instead of attribute or metric filter to the entire dashboard. Visualization-specific filters allows to customize results further by filtering a targeted visualization, independent of other visualizations in a dashboard.
STEPS TO FOLLOW:
Follow the steps below using the Strategy Tutorial project:
1. Create an Intelligent Cube, with Region, Category, Cost and Profit.
2. Create a Visual Insight dashboard and add the above cube as the dataset:
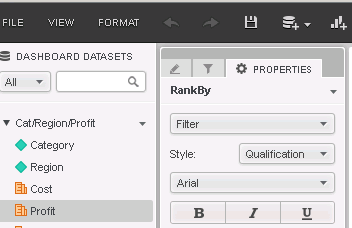
3. In the dashboard, create a derived metric, RankBy using the Rank function based on profit for Top10.
4. Create another derived metric, RankByDown using the Rank function based on profit for Bottom10.
5. Add Visualization1, with grid containing Region, Category, Profit and RankBy.
6. Sort RankBy by Ascending order.
7. Add Visualization2, with grid containing Region, Category, Profit and RankByDown.
8. Sort RankByDown by Ascending order:
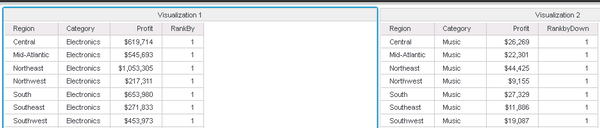
9. In the Filter setting, add Region and select "Central" Region.
10. The Filter applies to both Visualizations.
11. The visualizations displayed in step 8 show all the rows for both top and bottom customers.
12. In the menu, next to the "Insert Visualization", there is "Insert" drop down:
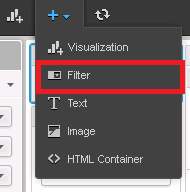
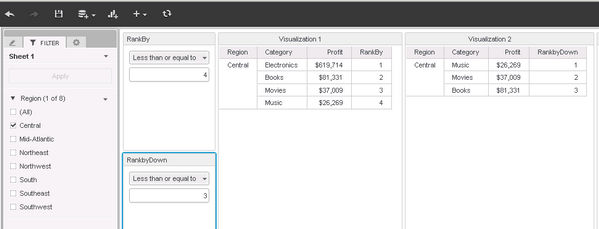
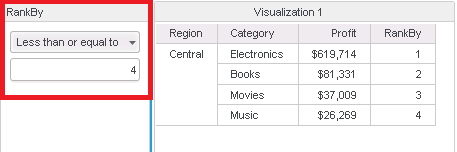
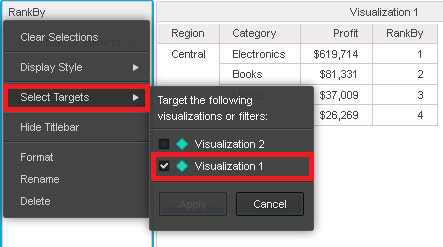
13. Choose "Filter" from the drop down and add RankBy less than or equals 4 and target Visualization1 as shown below:
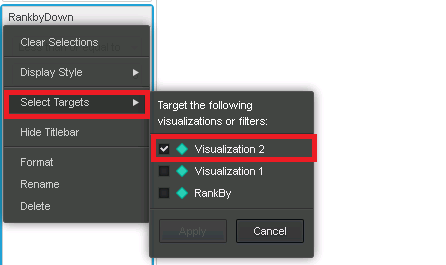
14. Repeat the above and add RankByDown less than or equals 3 and target Visualization2 as shown below:
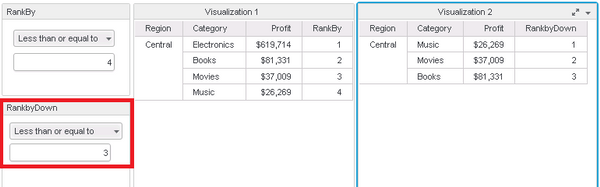
15. Now you will see only Top4 customers based on the profit in Visualization1 and Bottom3 customers based on the profit in Visualization2 for the "Central" Region only as shown below: