SYMPTOMS:
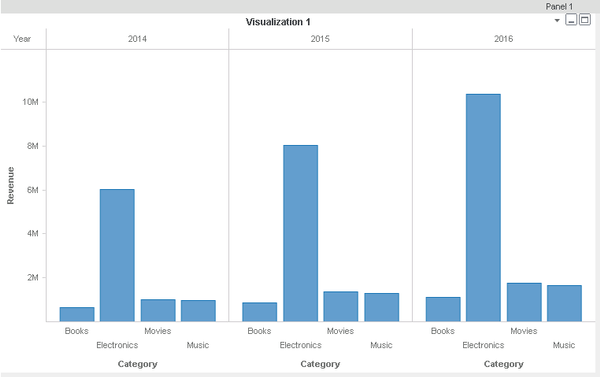
When converting the Visual Insight Dashboard into RS Document with Chart and applied threshold on a metric, the visualization displays correctly. However, after editing the threshold on newly converted document, the legend and the threshold disappears.
STEPS TO REPRODUCE:
Issue can be reproduced in MicroStartegy Tutorial project with following steps:
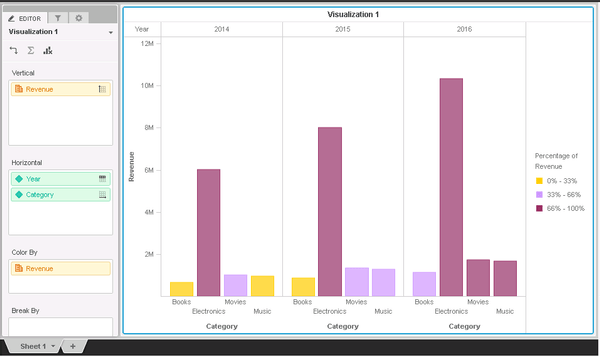
1. Create a VI Dashboard and add a simple report (for example Year, Category, Revenue). Change Visualization to a Bar Chart and apply color threshold on the metric as shown below:
2. Save the Dashboard, right click on the object and choose Convert it to Document. When prompted click OK.
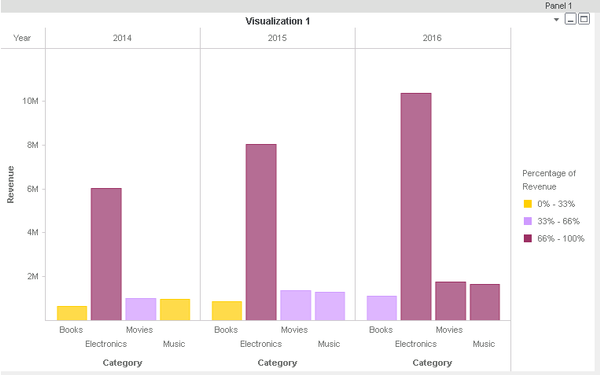
3. Go to presentation mode and verify if the document displays correctly as shown below:
4. Go back to editable mode, right click on the graph and choose thresholds -> Visual. Edit the threshold and apply changes.
5. Enter the presentation mode again. Notice that threshold and the legend is missing as shown below:
ACTION:
This is a known issue in Strategy Contact Strategy 10.x.
Contact Technical Support for an update on this issue.
