SYMPTOM
A report is created using a consolidation and a smart compound metric in Strategy. In the Strategy Tutorial project, for instance, such a report could include the Year attribute, Customer Geography Ratio consolidation, the Profit and Revenue metrics, and a compound metric dividing Profit by Revenue. (The compound metric also enables the "Allow Smart Metric" option in the Subtotals/Aggregation tab of the metric editor.)
In the following results, the Profit / Revenue results are different from the profit value for the row divided by the Revenue value on the same row, because the default evaluation order is to calculate compound metrics first and then consolidations. For instance, the Northeast / US consolidation element calculates the ratio of the Profit/Revenue percentage for the Northeast region alone, against the sum of the percentages in all US regions added together.

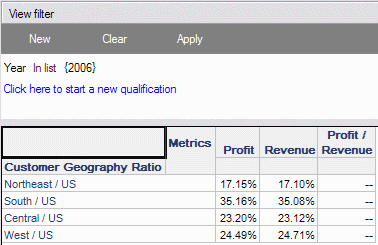
After adding a view filter Year in (2006), now Profit/Revenue shows the row-level quotient. The consolidation is calculated first, providing the row-level values, and the smart metric calculation takes place over these values.

The same occurs with the addition of derived metrics.
CAUSE
Adding a view filter to the report converts it into an OLAP Services report. OLAP Services reports involves two data sets: the base dataset comprising database, consolidation and custom group results, and the view dataset defined by OLAP Services features (dynamic aggregation, view filters, derived metrics).
When a report uses no OLAP Services features, it has only the base dataset. Consolidations and smart metrics are both calculated in the base dataset, and the default order is to calculate the smart metrics before consolidations. This is for data compatibility with compound metrics where the smart option is disabled. Since non-smart compound metrics are calculated in SQL, they are always evaluated before consolidations; the default behavior for smart metrics is the same. (Users can override the default using the Evaluation Order dialog.)
In OLAP Services reports, smart metrics evaluate as part of the view dataset by default. Since the view data are calculated from the base data, the view must be evaluated after the base. This has the side effect of moving the smart metric calculation to follow the consolidation.
ACTION
The following steps may be taken to restore the original evaluation order after adding a view filter or derived metrics.

With the smart metric moved back into the dataset, it can calculate before the consolidation as before.

Note: Calculating a smart metric in the dataset means that the metric will not be available for dynamic aggregation. Dynamic aggregation is inherently part of the view dataset. Forcing a smart metric to calculate in the base dataset removes the Analytical Engine instruction to perform the smart metric calculation over the dynamic aggregation result. Consequently, these metrics will display with dynamic aggregation nulls.
To illustrate in the example report, Year is pivoted off the template into the Report Objects window. Since Profit / Revenue is disabled for calculation in the view, its column is empty.
While this dynamic aggregation behavior may seem to be an arbitrary limitation, it is a necessary consequence of the object definitions. Under dynamic aggregation, smart metrics should perform their compound metric calculations using the dynamically-aggregated results for each component metric. The calculation would thus take place after consolidations; as already noted, this is not the desired behavior for this metric. If, on the other hand, the division operation in the smart metric were calculated in the dataset (prior to the consolidation) and those results were aggregated by Sum or another function, then the compound metric would no longer be a smart metric. Neither result would meet the reporting requirement, and the dynamic aggregation nulls alert the user to the fact that the numbers would not have been what was expected.
