EducationSoftwareStrategy.com
StrategyCommunity

Knowledge Base

Product

Community

Knowledge Base

TopicsBrowse ArticlesDeveloper Zone

Product

Download SoftwareProduct DocumentationSecurity Hub

Education

Tutorial VideosSolution GalleryEducation courses

Community

GuidelinesGrandmastersEvents
x_social-icon_white.svglinkedin_social-icon_white.svg
Strategy logoCommunity

© Strategy Inc. All Rights Reserved.

LegalTerms of UsePrivacy Policy
  1. Home
  2. Topics

KB31920: How to make the metric bars on graph display against different Y axis in MicroStrategy Developer 9.4.x-10.x?


Stefan Zepeda

Salesforce Solutions Architect • Strategy


The following procedure describes how to make different metrics display against different Y axis

The metric values on Strategy report may be on very wide scale. For example, in a report with metrics "Revenue","Cost" and "Profit Margin" on it,  the value of "Profit Margin" is in percentage so that it's much smaller than "Revenue" and "Cost". The graph bar of Profit Margin is very inconspicuous when viewing the report in Graph bar mode as the screenshot bellow:

ka02R000000kcYyQAI_0EM440000002EE9.jpeg

  
The following procedure describes how to make different metrics display against different Y axis.
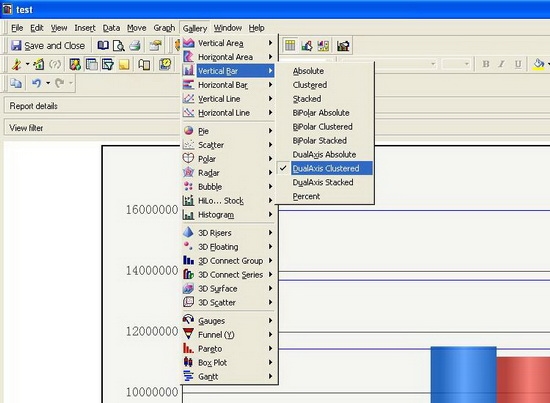
  • Select "DualAxis Clustered" under "Gallery" menu followed by "Vertical Bar",as shown below:  
ka02R000000kcYyQAI_0EM440000002EE4.jpeg
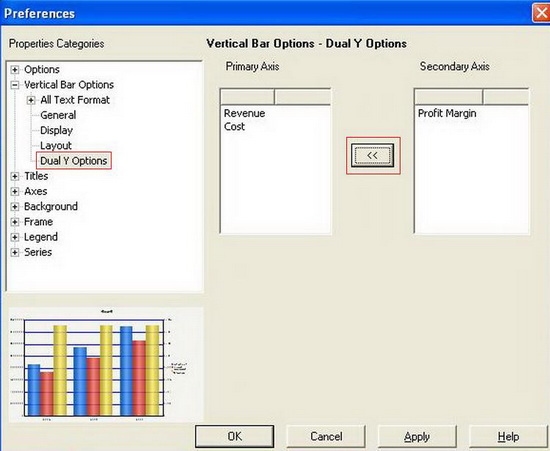
  • Locate to menu Graph -> Graph Options -> Vertical Bar Options -> Dual Y Options,and use the "arrow button" to re-arrange the metrics to the two Y axes, as shown below:  
ka02R000000kcYyQAI_0EM440000002EDz.jpeg
  • The bar of "Profit Margin" is viewable now: 
ka02R000000kcYyQAI_0EM440000002EE7.jpeg

Comment

0 comments

Details

Knowledge Article

Published:

April 13, 2017

Last Updated:

April 13, 2017