SYMPTOM:
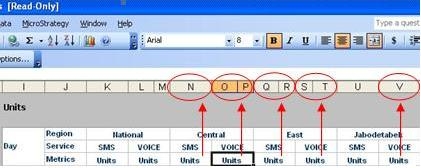
After creating a dashboard in Strategy Web, export it to excel, some metrics occupy different number of cells as shown below: (notice that each metric should occupy one Excel column)
STEPS TO REPRODUCE:
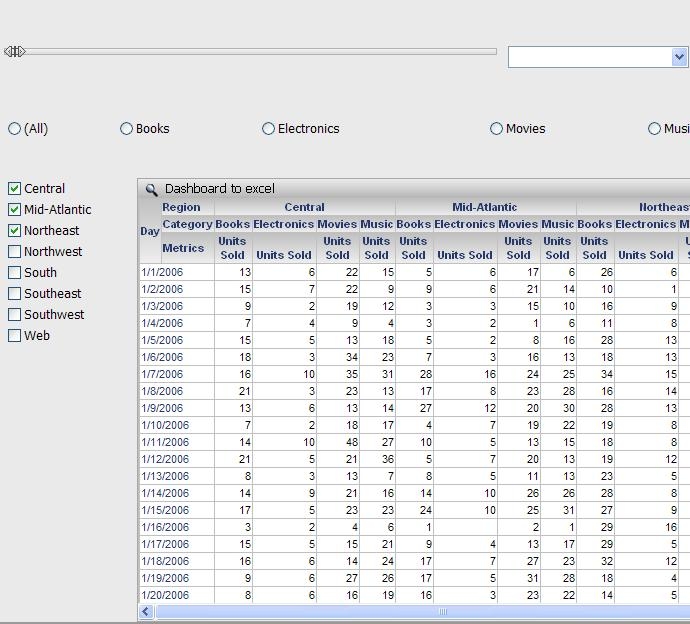
Follow the steps below to reproduce the issue in Strategy Tutorial project:
CAUSE:
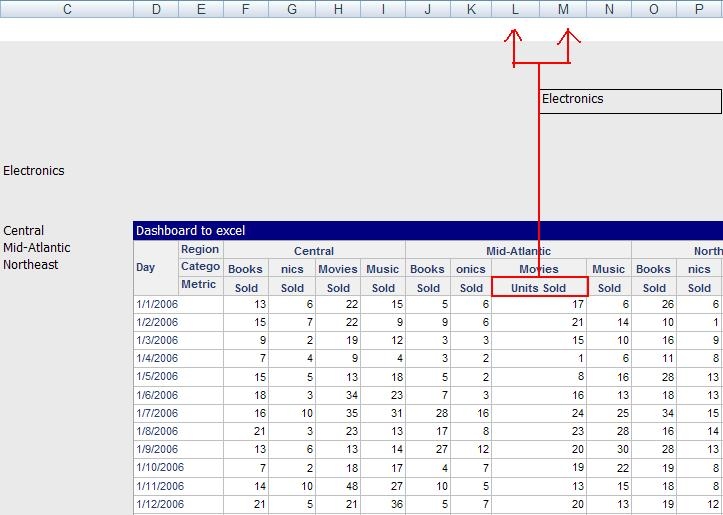
This is working by design. In Excel, all contents are in a table. Strategy design is to consider the locations of all objects, and make sure that all objects are relatively located at a right position. When adding a 'Selector' on top of the grid metric, the Excel column aligns with the 'Selector' too causing the mismatch in the column assignment.
ACTION:
If user wants one column for each metric, user needs to design the document accordingly. For example, move it to the side of the grid report.
