SYMPTOM:
After enabling value data labels for Bar Chart visualization on Visual Insight dashboard in Strategy 10.4 data labels with value 0 are not displayed.
STEPS TO REPRODUCE:
Follow the steps below to reproduce the issue in Strategy Tutorial project:
1. Create a Visual Insight (VI) dashboard and insert as dataset a New Report with one attribute and one metric; at least one of the attribute elements should have value 0 for the metric chosen.
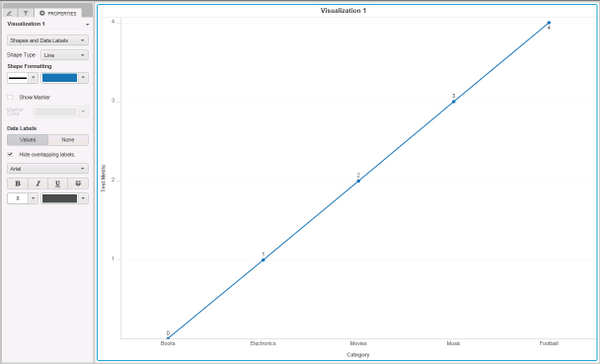
2. Change visualization to Line chart.
3. Go to Properties and select from the drop down menu Shapes and Data Labels.
4. Enable Data Labels values and mark Hide overlapping labels. Data labels are all properly displayed, as shown below:
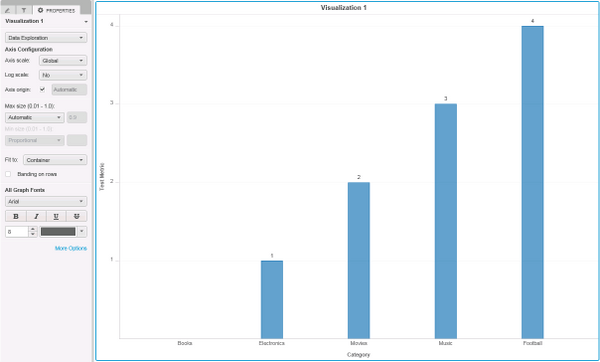
5. Change visualization to Bar Chart; data label with value 0 is not displayed, as shown below
CAUSE:
This is a known issue in Strategy Web 10.4 and its being investigated.
ACTION:
Contact Strategy Technical Support for an update on the issue.
WORKAROUND:
- Create a new derived metric and put the metric “on hand qty” as formula inside it and also name it as “on hand qty”.
- Add the derived metric on the bar chart on the right y-axis.
- Change the display type of the derived metric from bar chart to “tick”.
- Align the colors of the bar chart and the tick chart
- Enable data labels for the derived metric only and disable it for the metric.