EducationSoftwareStrategy.com
StrategyCommunity

Knowledge Base

Product

Community

Knowledge Base

TopicsBrowse ArticlesDeveloper Zone

Product

Download SoftwareProduct DocumentationSecurity Hub

Education

Tutorial VideosSolution GalleryEducation courses

Community

GuidelinesGrandmastersEvents
x_social-icon_white.svglinkedin_social-icon_white.svg
Strategy logoCommunity

© Strategy Inc. All Rights Reserved.

LegalTerms of UsePrivacy Policy
  1. Home
  2. Topics

KB320523: How to display the difference between high value and low value n in stock graph


Stefan Zepeda

Salesforce Solutions Architect • Strategy


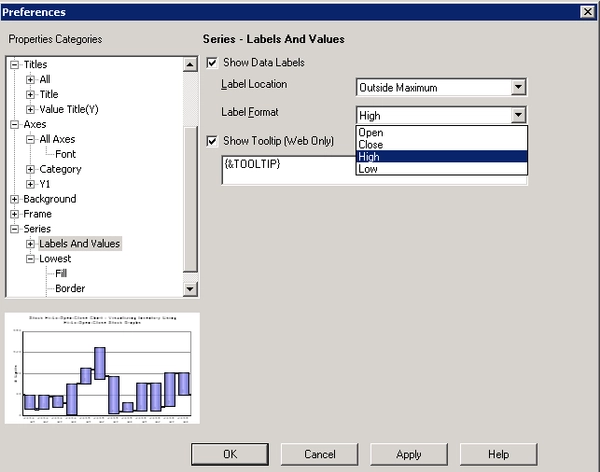
In stock graph, the size of each column represents the difference between the high and low values. If it is set to display the data labels, only a single value is displayed. Users can select to display either the high, low, open, or close value as the data label for the stock graph, but it cannot display the difference of high value and low value.
SYMPTOM:
In stock graph, the size of each column represents the difference between the high and low values. If it is set to display the data labels, only a single value is displayed. Users can select to display either the high, low, open, or close value as the data label for the stock graph, but it cannot display the difference of high value and low value.

ka02R000000kXDTQA2_0EM440000002Bz3.jpeg

WORKAROUND:
Use the stacked vertical bar graph instead of stock graph to display the difference between high and low value .

  • Create a report with Cost and 'Revenue-Cost', as showed below.
ka02R000000kXDTQA2_0EM440000002Byy.jpeg
  • Choose the graph type as stacked vertical Bar, as showed below.
ka02R000000kXDTQA2_0EM440000002Bz5.jpeg
  • Remove the label of Cost and set the transparency to 100%
ka02R000000kXDTQA2_0EM440000002Byv.jpeg


Comment

0 comments

Details

Knowledge Article

Published:

April 5, 2017

Last Updated:

April 5, 2017