EducationSoftwareStrategy.com
StrategyCommunity

Knowledge Base

Product

Community

Knowledge Base

TopicsBrowse ArticlesDeveloper Zone

Product

Download SoftwareProduct DocumentationSecurity Hub

Education

Tutorial VideosSolution GalleryEducation courses

Community

GuidelinesGrandmastersEvents
x_social-icon_white.svglinkedin_social-icon_white.svg
Strategy logoCommunity

© Strategy Inc. All Rights Reserved.

LegalTerms of UsePrivacy Policy
  1. Home
  2. Topics

KB32330: The data label disappears when a pie chart graph is exported as live Excel charts in MicroStrategy Web


Community Admin

• Strategy


The data label disappears when a pie chart graph is exported as live Excel charts in MicroStrategy Web 9.0.x

SYMPTOM:
 
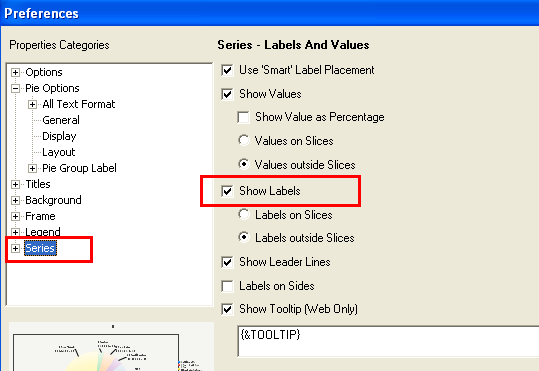
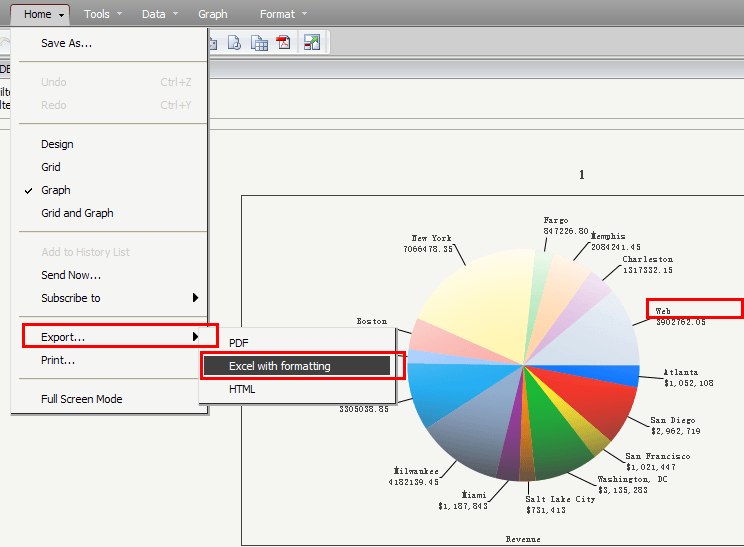
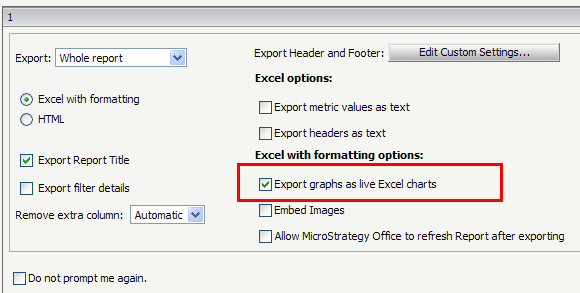
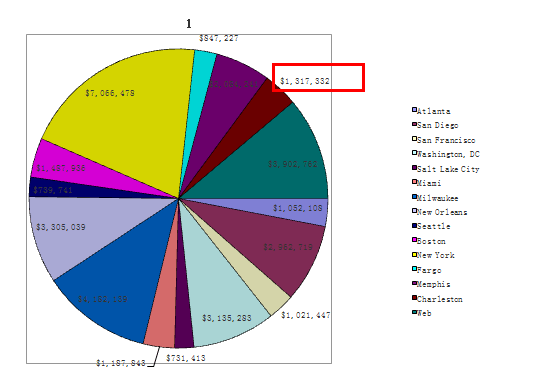
Create a pie chart graph, enable the data label option and then export the graph report as live Excel charts in Strategy Web 9.0.x, the data label disappears in the exported Excel charts. 
 
STEPS TO REPRODUCE:
Follow the steps below to reproduce the issue with Strategy Tutorial project:

  • Create a report with "Call Center" in row and "Revenue" in Column. View the report in Graph and select the graph type as "Pie".
  • Right click on the graph and select Graph option in Desktop. Then, navigate to Graph Options->Series->check `Show Labels`->save and close, as shown below: 
     
ka04W00000148WGQAY_0EM44000000286N.png
  • Open the graph report in Web and export it to "Excel with formatting", as shown below: 
     
ka04W00000148WGQAY_0EM44000000286T.png
  • Check the option as "Export graphs as live Excel charts" in the Export Options page, as shown below: 
     
ka04W00000148WGQAY_0EM44000000286R.png
  • Open the exported Excel file and find that the labels are not displayed, as shown below:  
ka04W00000148WGQAY_0EM44000000286X.png

CAUSE:
 
It is a known issue in Strategy Web 9.0.x.
 
ACTION:
 
This issue has been fix confirmed in Strategy Web 9.0.2. Upgrade to 9.0.2 or higher to take advantage of the fix.
 
WORKAROUND:
 
Do not check "Export graphs as live Excel charts" in the Export Options page and export the graph report into a static Excel chart instead as a workaround for this issue.


Comment

0 comments

Details

Knowledge Article

Published:

June 15, 2017

Last Updated:

June 17, 2020