SUMMARY
This Technical Note describes how data blending handles related attributes when joining datasets in Strategy 10.x
EXPLANATION
In Strategy 10.x when joining two datasets together on a document or dashboard data blending is used. This pairs rows from each dataset together. Shared attributes are outer joined while relationships control other related attributes. Unrelated and nonshared attributes will be cartesian joined. With related attributes however the amount of information present and the type of relationship matters as some designs will have insufficient information to properly pair rows together. To ensure good behavior with the join the maximum number of attributes possible should be shared between datasets and situations where each dataset has attributes related to the shared attribute but not present on the other should be avoided. Many of the common situations are seen below in the given examples. When troubleshooting issues with data blending all attributes from both datasets should be included on a grid with metrics to be able to examine the underlying join behavior.
EXAMPLES
There are several common example scenarios where data blending can be used.
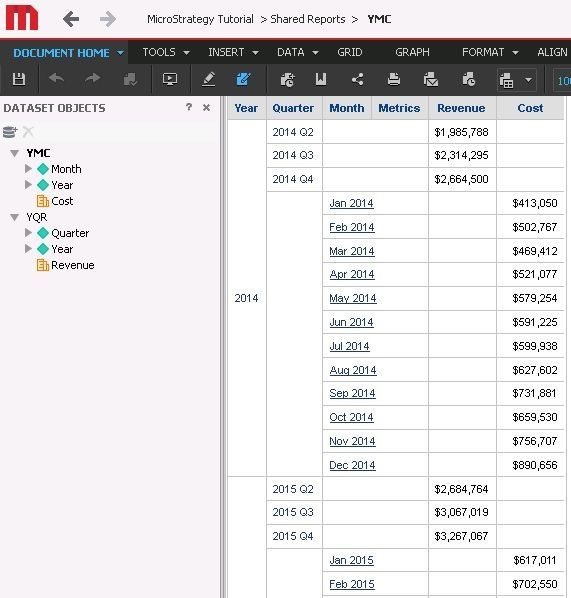
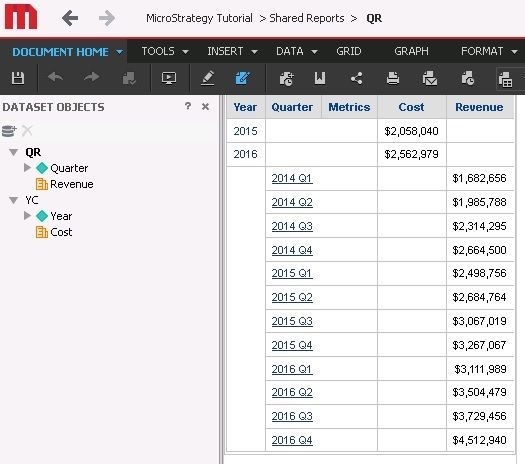
EX 1.
One dataset has an additional child attribute not present on the other dataset.
As can be seen the metric coming from the higher level dataset is repeated across the rows for the elements of the child attribute. Null values can be seen if the higher level report has attribute elements of the shared attribute that are not present at all in the lower level report.
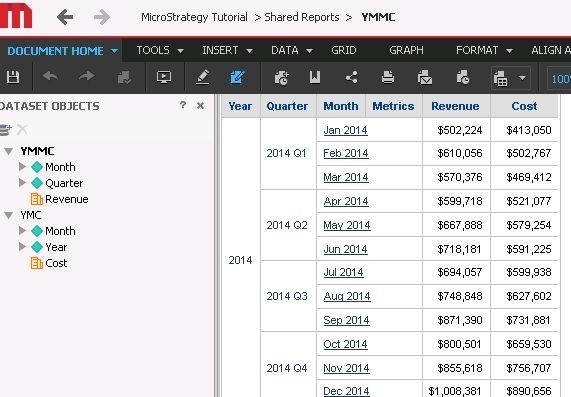
EX 2.
The two datasets share a child attribute.
With child present
Child not present
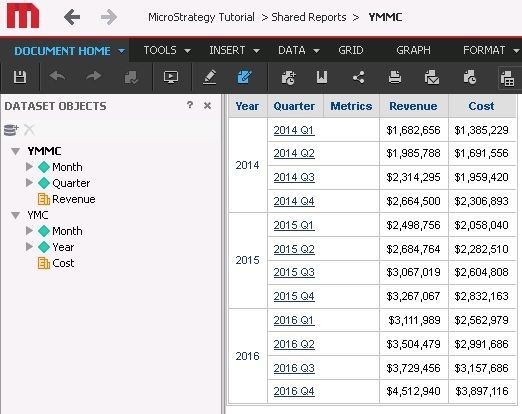
As can be seen here using a shared child sufficiently identifies data allowing for correct joins between the datasets regardless of if the child attribute is present.
EX 3.
The two datasets share a parent attribute.
As can be seen here the rows are kept completely separate. The presence of a different child on each dataset for the shared attribute prevents the product from placing the rows together. Specifically the datasets contain information about how their specific attributes are related but no dataset contains information about the relationship between the two children so it is impossible for the product to know which elements of child1 belong under which elements of child2. This forces the rows to be kept separate. In the example adding quarter to the month level report would keep the calculation the same but allow the join to function correctly.
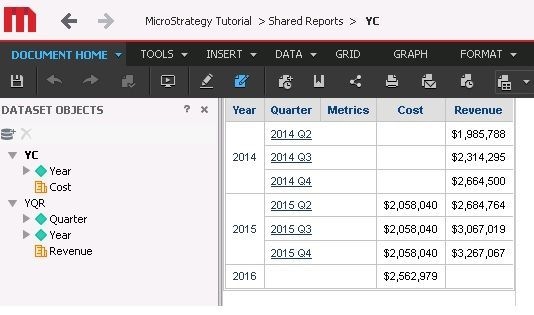
EX 4.
No shared attributes.
Here, again like above, the rows from the two datasets are kept separate. There is no shared attribute to use to join rows together but the relationship between the attributes prevents them from being cartesian joined. As Strategy does not have a dataset to describe the relationships between quarter and year elements present on the document the rows are just kept separate. Adding year to the quarter level dataset would give you a workaround without changing the calculation level.
FINAL NOTES
As can be seen from the above examples the key point is to make sure to avoid having different attributes on each dataset that are related without there being a shared attribute present that is a key underneath them. Much of this applies to data import cubes with data blending as relationships are autodetected between data import attributes. This means there are often parent/child relationships that are not shared and may cause undesired joins of rows.