EducationSoftwareStrategy.com
StrategyCommunity

Knowledge Base

Product

Community

Knowledge Base

TopicsBrowse ArticlesDeveloper Zone

Product

Download SoftwareProduct DocumentationSecurity Hub

Education

Tutorial VideosSolution GalleryEducation courses

Community

GuidelinesGrandmastersEvents
x_social-icon_white.svglinkedin_social-icon_white.svg
Strategy logoCommunity

© Strategy Inc. All Rights Reserved.

LegalTerms of UsePrivacy Policy
  1. Home
  2. Topics

KB324282: When using a metric with data type “Text”, the aggregation of derived metrics and other functionalities, such as thresholds, might not act as expected in VI.


Community Admin

• Strategy


SUMMARY:
There might be cases in which some issues are encountered when trying to perform certain actions in a metric in a VI dashboard, whether the feature that is trying to be used does not apply correctly or the results are not the expected.
 
SYMPTOM:
The following issues have been encountered and reported when using a string as metric:

  1. The Sum function doesn’t work for derived metrics created using that metric.
  2. Setting a threshold on a derived metric using the max function does not work correctly.

 
STEPS TO REPRODUCE:
Sum function doesn’t work for derived metrics

  1. Add a dataset to a VI that contains a metric that is a string (“Metric String” in this example).
  2. Create a derived metric (“New Metric”) with the following syntax:


Sum([Metric String]){~+, [Attribute 2]+}
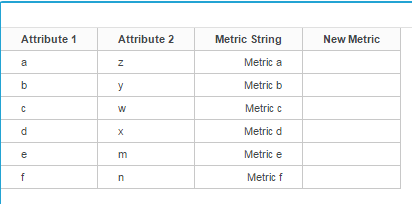
 

  1. Add that metric in a grid visualization, you will notice the cells are blank:
ka04W000000OfqlQAC_0EM4400000025Lp.jpeg

 
Setting a threshold on a derived metric using the max function

  1. Add a dataset to a VI that contains a metric that is a string (“Metric Number” in this example).
  2. Create a derived metric (“Max Metric”) with the following syntax:


Max([Metric Number]){~+}


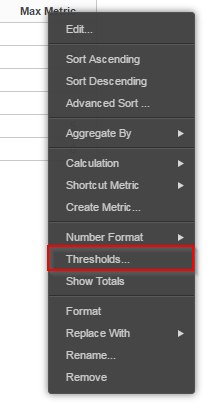
  1. Add the metric to a visualization, then right click and select “Thresholds”:
ka04W000000OfqlQAC_0EM4400000025M3.jpeg
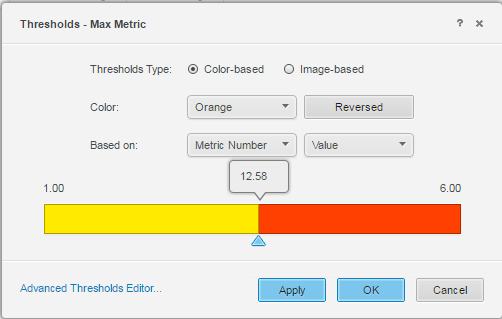
  1. Edit the threshold and set it based on value and with only two thresholds:


ka04W000000OfqlQAC_0EM4400000025M6.jpeg


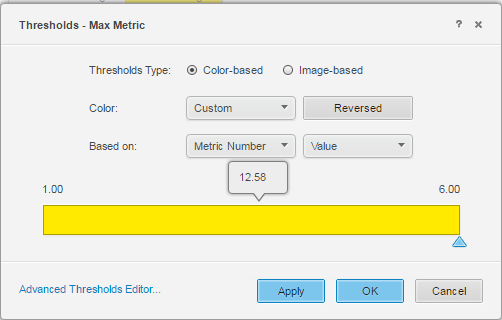
  1. Click Ok, you will notice the threshold changes to one color and the grid reflects the same:


ka04W000000OfqlQAC_0EM4400000025Lo.jpeg

 
CAUSE:
The root cause of the issues mentioned above is the data type of the metric being used (Text).
In order to determine if the issue being experienced has to do with the data type, you can verify whether the metric is String, and are described below:

  1. Go to the dataset that contains the metric, select the dropdown and select “Edit dataset”:

Select the dropdown for the metric and go to “Change Data Type”, if “Text” is chosen, the data type is String.

  1. Another way to test this is to create a derived metric using a simple function, such as:


Metric+1

If the data cells of this metric are empty, the data type is String.
 
ACTION:
To avoid these type of issues, change the data type of the metric. This can be accomplished in the following ways:

  1. If the metric is a stand-alone metric based on a fact in the schema, this can be changed in Developer, by editing the fact, going to the “Column Alias” tab and make sure to set this to a number data type.
  2. If the metric is coming from a Data Import dataset, this can be changed editing the dataset, then selecting the dropdown for the metric and go to “Change Data Type”, then selecting one that is not Text:


  1. A derived metric can be created in VI, using the following formula:


ToNumber([Metric String])

To convert the “String” data type to number.


Comment

0 comments

Details

Knowledge Article

Published:

June 12, 2017

Last Updated:

June 12, 2017