EducationSoftwareStrategy.com
StrategyCommunity

Knowledge Base

Product

Community

Knowledge Base

TopicsBrowse ArticlesDeveloper Zone

Product

Download SoftwareProduct DocumentationSecurity Hub

Education

Tutorial VideosSolution GalleryEducation courses

Community

GuidelinesGrandmastersEvents
x_social-icon_white.svglinkedin_social-icon_white.svg
Strategy logoCommunity

© Strategy Inc. All Rights Reserved.

LegalTerms of UsePrivacy Policy
  1. Home
  2. Topics

KB33781: Some graphs in Report Services documents appear incomplete or cutoff after being exported to PDF in MicroStrategy 9.4.x.


Stefan Zepeda

Salesforce Solutions Architect • Strategy


This article discusses an issue seen when exporting graphs to PDF while certain colors are being used.

SYMPTOM:
When exporting a Report Services document to PDF format in Strategy 9.4.x, some of the graphs are cutoff or appear incomplete, as shown in the screenshot below:
 
HTML View:
 

ka02R000000kch6QAA_0EM440000002E2Q.jpeg

 
PDF View:
 

ka02R000000kch6QAA_0EM440000002E2d.jpeg

 
CAUSE:
By default, Strategy 9.4.x utilizes Vector Graphs for images when exporting a Report Services document to PDF, these support less colors and less combinations than bitmaps, but are smaller in size and can be resized better. However, certain combinations of colors could be displayed incorrectly.
 
ACTION:
Export the graph as a bitmap following the steps below:
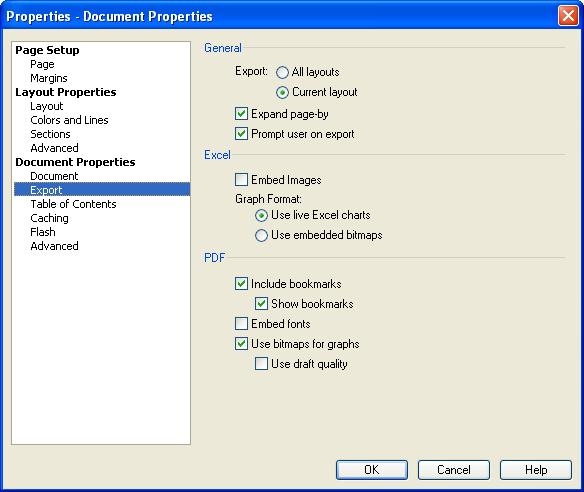
  • Go to Format > Document Properties > Export.
  • Check the "Use bitmaps for graphs" setting.
ka02R000000kch6QAA_0EM440000002E2c.jpeg

The only drawback to this workaround is that the PDF will be slightly bigger in size.  Another option, is to change the graph's colors and size looking for a different combination that the Vector Graph image can display.


Comment

0 comments

Details

Knowledge Article

Published:

April 4, 2017

Last Updated:

April 4, 2017