EducationSoftwareStrategy.com
StrategyCommunity

Knowledge Base

Product

Community

Knowledge Base

TopicsBrowse ArticlesDeveloper Zone

Product

Download SoftwareProduct DocumentationSecurity Hub

Education

Tutorial VideosSolution GalleryEducation courses

Community

GuidelinesGrandmastersEvents
x_social-icon_white.svglinkedin_social-icon_white.svg
Strategy logoCommunity

© Strategy Inc. All Rights Reserved.

LegalTerms of UsePrivacy Policy
  1. Home
  2. Topics

KB34248: Static text displayed in DHTML modes after adding a dynamic tooltip to a grid or graph in a Report Services document


Community Admin

• Strategy


With effect from version 9.0.0, it is possible to add dynamic tooltips to text boxes in Report Services documents to display a summary of data in all three DHTML modes (Editable, Interactive or View). However, dynamic tooltips added to grids and graphs are displayed as static text after executing the document in Web.

SYMPTOM:
 
With effect from version 9.0.0, it is possible to add dynamic tooltips to text boxes in Report Services documents to display a summary of data in all three DHTML modes (Editable, Interactive or View).  However, dynamic tooltips added to grids and graphs are displayed as static text after executing the document in Web.
 
STEPS TO REPRODUCE:
 
This issue can be reproduced in the Strategy Tutorial project as follows:

  • Create a simple report containing the Customer Region attribute and the Revenue metric
  • Create a dashboard based on the above report
  • Add a simple grid to any header or footer section, with the Customer Region attribute in the rows and the Revenue metric in the columns: 
     
ka04W000001MKoWQAW_0EM4400000027tv.jpeg
  • Select the grid and right-click to access `Properties and Formatting`
  • Under `General`, type a concatenation of dynamic and static text in the section assigned for `Tooltip`, such as the following:
     
ka04W000001MKoWQAW_0EM4400000027tx.jpeg
  •  
    Revenue for {} is {Revenue}
     
  • View the dashboard in any DHTML mode in Strategy Web 9.x.  When hovering over the metric values, the tooltip is displayed exactly as typed (Revenue for {} is {Revenue}).  The values for the attribute element and metric are not populated:
     
ka04W000001MKoWQAW_0EM4400000027tr.jpeg
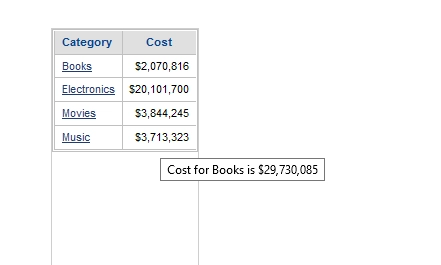
  • For Strategy Web 10.x, it displays as the first attribute element and in-total metric value. Still static.
ka04W000001MKoWQAW_0EM440000002IZZ.png

CAUSE:
 
Dynamic tooltips are not currently supported for use with grids or graphs in the DHTML modes.
 
ACTION:
 
An enhancement request has been logged for this functionality to be considered for a future Strategy version. Strategy will continue to investigate and post updates as soon as they are available.


Comment

0 comments

Details

Knowledge Article

Published:

April 6, 2017

Last Updated:

April 7, 2017