When configuring Kerberos Authentication with Strategy Web, Wireshark can be used to further analyze the communications between the browser and the Key Distribution Center also known as KDC.
The client browser communicates with the KDC to make sure that the service that it is trying to contact, in this case Strategy Web, exists. To do so it sends a message to the KDC asking if a service principal name with name HTTP/ exists in the KDC database.
Sometimes this step produces issues in the form of the being wrong, either in the form of the browser querying for the wrong machine name or the service principal name set up in the Domain Controller. The most common issues found with this type of error is defining the service principal name as HTTP/ whilst the browser client queries the KDC for HTTP/.
In order to check for the Service Principal Name the browser is requesting for validation, or to find out further Kerberos error codes, Wireshark logging can be used.
Wireshark is a free and open-source packet analyzer, if installed in the client machine it will tell us the Service Principal Name the client browser is trying to verify with the KDC.
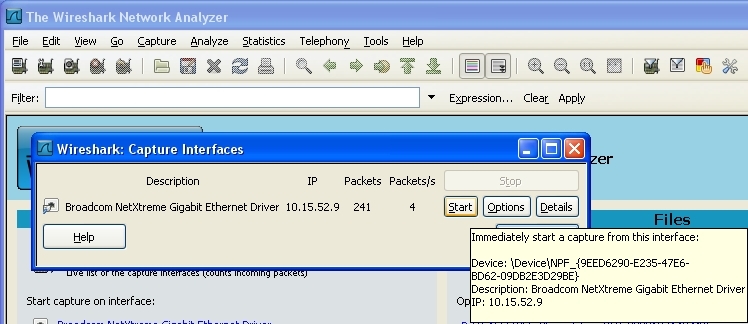
After installing Wireshark, you can start a capture by clicking on the most upper left icon and clicking on "Start" for the active interface
After reproducing the issue, stop the capture and save the trace.
To check what Service Principal Name the client browser is using, filter the obtained trace with the keyword "Kerberos"
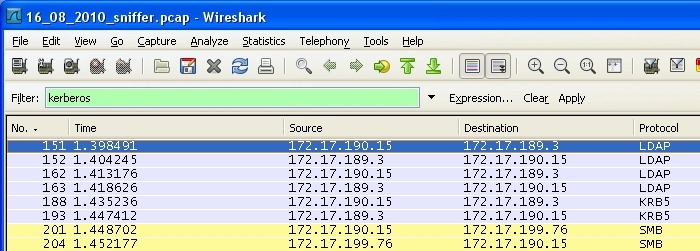
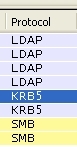
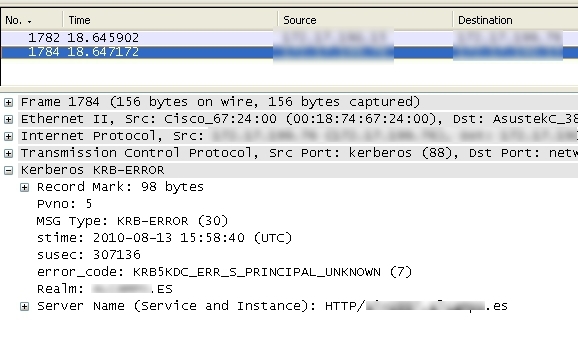
The traces on screen will display further information. The traces of interest in terms of troubleshooting Kerberos are the ones labelled for the krb5 protocol, as shown below:
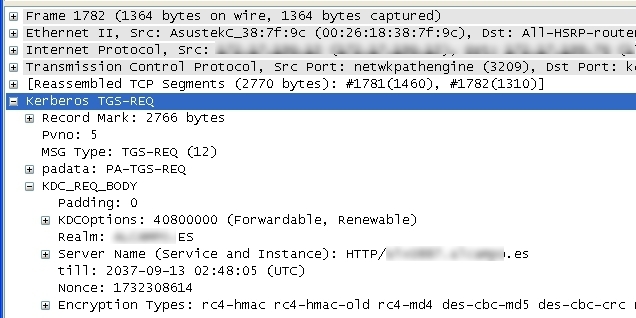
Selecting the trace going from the Client to the KDC will show the IP addresses of those two machines, if we expand the Kerberos TGS-REQ - KDC_REQ_BODY we will be able to see the service principal name constructed by the client browser, the encryption types supported, the realm name used, etc...
If the KDC encountered any problems with the request, that information will be available in the trace captured between the KDC and the client browser.
Third Party Software Installation WARNING
The third-party product(s) discussed in this technical note is manufactured by vendors independent of Strategy. Strategy makes no warranty, express, implied or otherwise, regarding this product, including its performance or reliability.
KB34369