EducationSoftwareStrategy.com
StrategyCommunity

Knowledge Base

Product

Community

Knowledge Base

TopicsBrowse ArticlesDeveloper Zone

Product

Download SoftwareProduct DocumentationSecurity Hub

Education

Tutorial VideosSolution GalleryEducation courses

Community

GuidelinesGrandmastersEvents
x_social-icon_white.svglinkedin_social-icon_white.svg
Strategy logoCommunity

© Strategy Inc. All Rights Reserved.

LegalTerms of UsePrivacy Policy
  1. Home
  2. Topics

KB34550: How to use custom groups to display sums of metric values for specified rows of data in MicroStrategy Desktop


Community Admin

• Strategy


This article explains how to use custom groups to display sums of metric values for specified rows of data in MicroStrategy Developer.

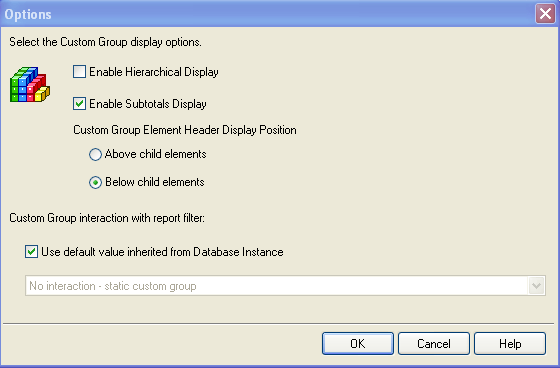
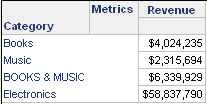
When subtotals are enabled, they typically calculate a value across all rows in the report. Custom groups can be used to sum values at a more granular level when required.
 
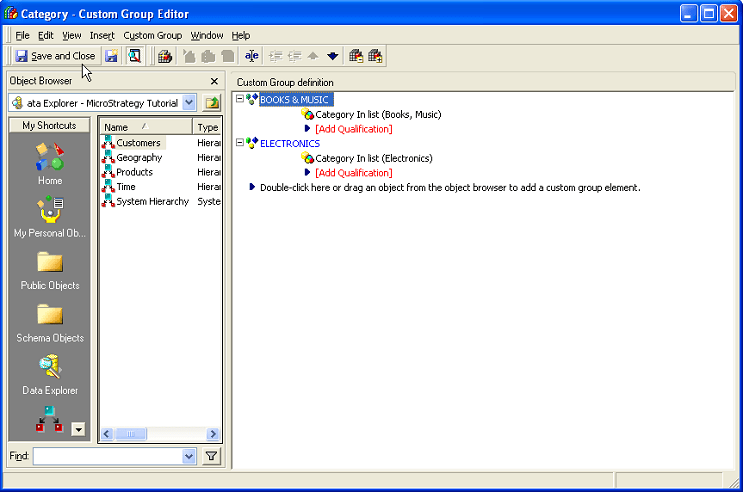
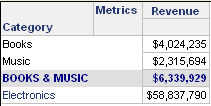
The following procedure describes how to display a sum for metric values concerning only particular attribute elements, rather than a total sum for metric values across all all rows in the report.
 

  • Create a new Custom Group. Each Custom Group element should only include the attribute elements that the partial sum will be calculated for. The Custom Group element name should reflect what the user would like to call the partial sum.
ka0PW0000000qjNYAQ_0EM440000002Dwi.png
  • Go to Custom Group menu > Options and select the checkbox for "Enable Subtotals Display". The option for "Enable Hierarchical Display" should not be selected if the user wishes to keep the display of the Custom Group element name and the component Attribute element names aligned. The "Custom Group Element Header Display Position" should be selected to reflect where the user would like to display the partial sum.
ka0PW0000000qjNYAQ_0EM440000002Dwl.png
  •  To control the display of which Custom Group elements display sums, right click on the Custom Group element, and select "Show Display Options". If the element name is shown, then the sum will be shown. In this example, only the sum for the Books and Music Categories will be shown.
ka0PW0000000qjNYAQ_0EM440000002Dwk.png
  • Place the newly created custom group on a report with the desired metrics.
ka0PW0000000qjNYAQ_0EM440000002Dwp.png
  • Additional formatting can be done to manipulate the final report display by right clicking on the custom group element and selecting "Formatting Properties". Note that formatting for Individual Items will default to the formatting defined for custom group elements. Below is an example of a grid that appears to display a sum for only the Book and Music elements of the Category Attribute.
ka0PW0000000qjNYAQ_0EM440000002Dwn.png


KB34550


Comment

0 comments

Details

Knowledge Article

Published:

June 16, 2017

Last Updated:

February 26, 2024