SYMPTOM:
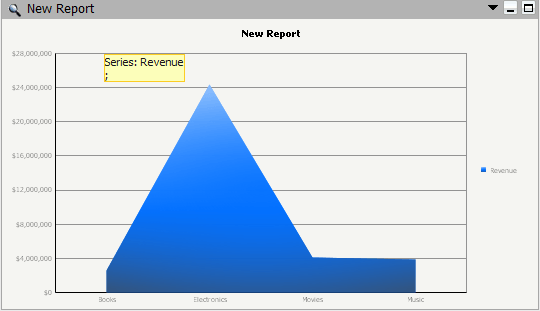
The category and value headers of a tooltip are not displayed on the area graph even though the user has {&TOOLTIP} in the Properties for a Report Services Document in Strategy Web 9.x. When executing the document in Strategy Web, it displays as shown below:
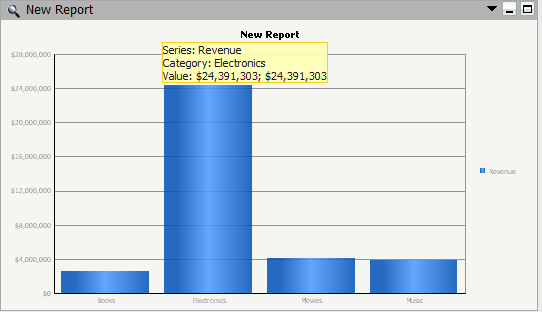
However, when the user executes the document using a bar graph, it displays correctly, as shown below.
CAUSE:
This behavior is by design. In this particular case, the graph cannot distinguish to what category the data point belongs to as the area chart is continuous and has no breaks. The graph can only display the Series.
WORKAROUND:
Use a bar graph to display the category and value for too tips.
