EducationSoftwareStrategy.com
StrategyCommunity

Knowledge Base

Product

Community

Knowledge Base

TopicsBrowse ArticlesDeveloper Zone

Product

Download SoftwareProduct DocumentationSecurity Hub

Education

Tutorial VideosSolution GalleryEducation courses

Community

GuidelinesGrandmastersEvents
x_social-icon_white.svglinkedin_social-icon_white.svg
Strategy logoCommunity

© Strategy Inc. All Rights Reserved.

LegalTerms of UsePrivacy Policy
  1. Home
  2. Topics

KB36064: How to integrate MicroStrategy Report with Google Map in MicroStrategy Web 9.x and 10.x


Community Admin

• Strategy


This Article discusses how to integrate MicroStrategy Report with Google Map in MicroStrategy Web 9.x and 10.x

Before using Google Map in Strategy Report, user needs to fulfill the prerequisites
 
1) Create a report with the following characteristics:

  • Attributes or attribute forms that supply latitude and longitude
  • At least one metric
  • Rows and columns that are not merged

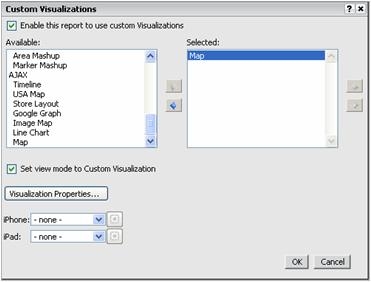
2) Apply custom visualization on the report and Configure Map Properties:
 

ka04W000000Oel1QAC_0EM440000002HRs.jpeg


3) Display Google Map in Image Marker or Dynamic Bubble style:
 
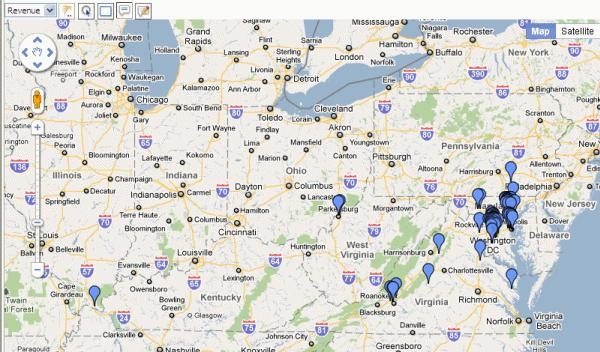
Image Markers:
ka04W000000Oel1QAC_0EM440000002HRr.jpeg
  • If users are using image markers and apply color-coded threshold, the markers are replaced by circles that are uniformly sized and color-coded based on the threshold color associated with the value of the metric for that location
  • If users are using image markers and apply custom image threshold, the markers are replaced by the custom images

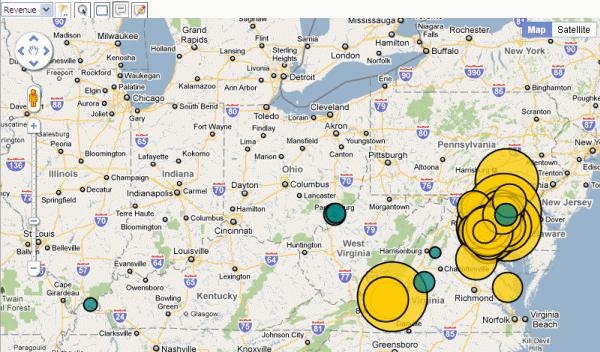
Dynamic Bubbles:

ka04W000000Oel1QAC_0EM440000002HRz.jpeg
  • If users are using dynamic bubbles on the map, the value of the metric determines the size of the bubbles.
  • If users are using dynamic bubbles and apply color-coded threshold, the bubbles are color-coded based on the threshold color associated with the value of the metric for that location.

Note: User should not use dynamic bubbles and apply custom image threshold because it does not yield a meaningful visualization. The bubbles are simply replaced by uniformly-sized bubbles of default radius and color. This is not a recommended configuration. 


Comment

0 comments

Details

Knowledge Article

Published:

June 7, 2017

Last Updated:

June 7, 2017